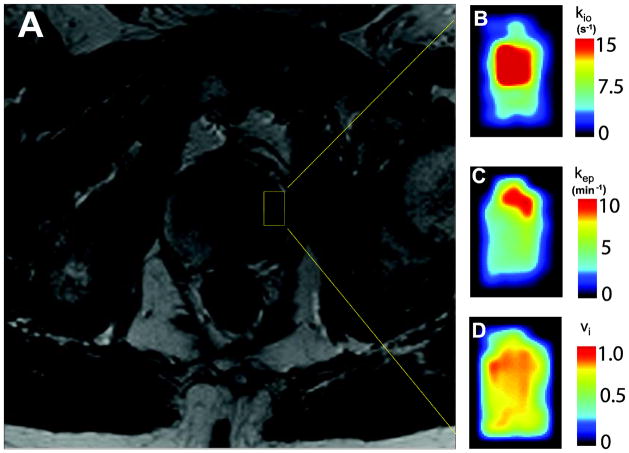
Figure 6.
Figure 6A shows a portion of an axial pelvic T2-weighted image of a 66 year old subject with left prostate malignancy (anterior up). Figures 6B–6D show zoomed parametric maps of a tumor-encompassing ROI in the left prostate indicated by the 6A yellow rectangle. Figure 6B is the kio map, which displays metabolic activity. Significantly elevated kio is clearly visible in the anterior half of the ROI. Figure 6C shows increased kep in only the most anterior portion of the ROI. The kep parameter measures capillary CR permeability. Figure 6D shows vi slightly elevated in the anterior half of the ROI. This most likely represents increased cell density. Black borders are added in 6B–6D to provide contrast with the elevated parametric color maps.

