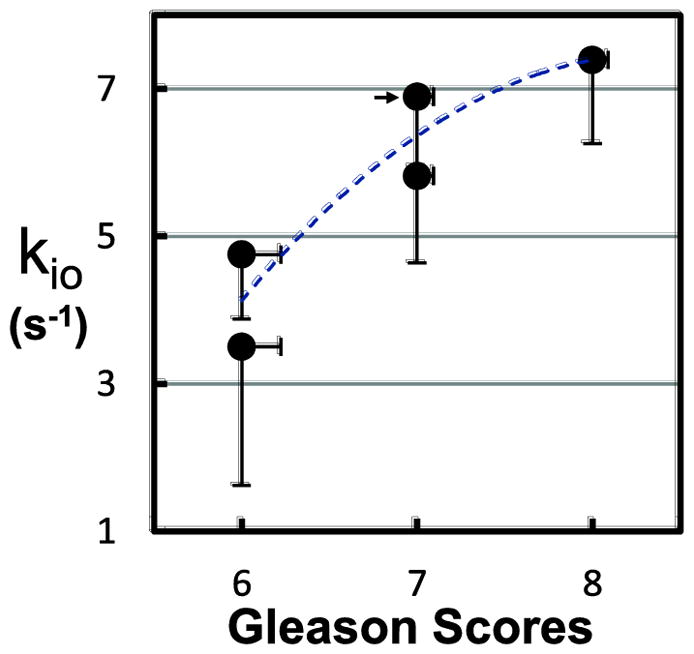
Figure 7.

Figure 7 plots lesion ROI-averaged in vivo kio values against independently obtained ex vivo Gleason scores for the five malignant cases. A clear trend of increasing kio with Gleason score (Spearman’s correlation coefficient, r = 0.91; p = 0.03) is observed (the empirical blue dashed curve is intended only to guide the eye). The error bars show kio standard errors and estimated Gleason score errors (see text).
