
Figure 3.
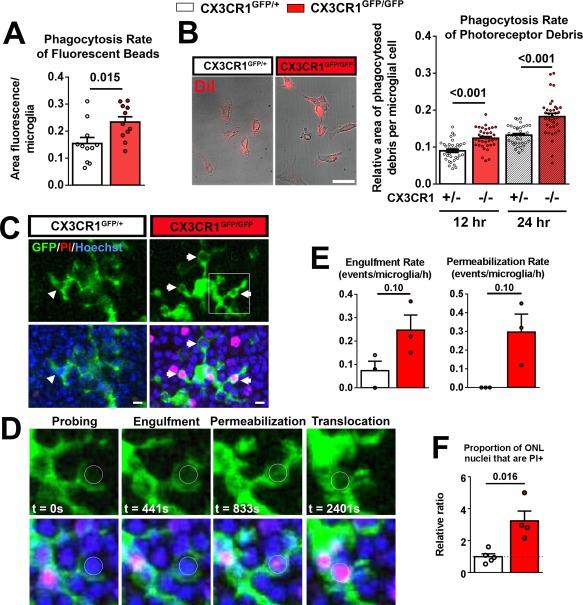
CX3CR1‐deficiency in retinal microglia is associated with increased phagocytic activity. Phagocytosis in microglia cultured from the retinas of CX3CR1GFP/+ and CX3CR1GFP/GFP mice were evaluated in two in vitro phagocytosis assays. (A) Microglia of each genotype was incubated in vitro with fluorescently labeled beads for 2 h and the internalization of beads by phagocytosis was scored. CX3CR1GFP/GFP microglia demonstrated a significantly higher rate of phagocytosis relative to CX3CR1GFP/+ microglia (n = 11 replicates for each genotype, P value from two‐tailed unpaired t test with Welch's correction). (B) Cultured microglia of each genotype were incubated with cellular debris from DiI‐labeled 661W photoreceptor cells for 12 and 24 h and mean internalization of DiI+ material by microglia (left panels) were measured. Scale bar, 5 μm. Significantly, more phagocytosis of photoreceptor debris was demonstrated by CX3CR1GFP/GFP microglia relative to CX3CR1GFP/+ microglia (N = 36 imaging fields from six biological replicates for each genotype, P values from two‐tailed multiple unpaired t tests, corrected for multiple comparisons, Holm–Sidak method). (C) Microglial phagocytosis of photoreceptor nuclei in the ONL was monitored by live imaging in retinal explants from rd10;CX3CR1GFP/+ and rd10;CX3CR1GFP/GFP mice isolated at P22‐24. Photoreceptor nuclei and permeabilized cells were labeled with Hoechst (blue) and propidium iodide (PI, red). Morphologically, rd10;CX3CR1GFP/GFP microglia contained more phagosomes (arrowheads) than rd10;CX3CR1GFP/+ microglia. Scale bar, 5 μm. (D) Magnified time‐lapse views from the inset in (C) demonstrate the sequential steps in the phagocytic process (circle indicates the nucleus of a phagocytosed photoreceptor) that involve: (1) initial probing of target cell, (2) engulfment of target cell by enveloping microglial processes, (3) permeabilization of the cell membrane of the target cell as evidenced by the development of PI‐labeling (red), and (4) translocation of photoreceptor nucleus toward the microglial soma. (E) The rates of engulfment and permeabilization events were scored and compared between the two genotypes of microglia. These mean rates tended to be greater for CX3CR1GFP/GFP relative to CX3CR1GFP/+ microglia but did not reach statistical significance (N = 3 recordings from each genotype, P values from Mann–Whitney test). (F) The relative proportion of ONL nuclei that were PI‐positive in each imaging field was compared between genotypes and normalized to that in rd10;CX3CR1GFP/+ retina. The proportion of permeabilized ONL nuclei was also significantly greater than in rd10;CX3CR1GFP/GFP retinas than in rd10;CX3CR1GFP/+ retinas (N = 4–5 recordings from each genotype, P values from Mann–Whitney test). Column heights (in A, B, E, F) indicate mean, error bars indicate ±SEM. [Color figure can be viewed in the online issue, which is available at wileyonlinelibrary.com.]