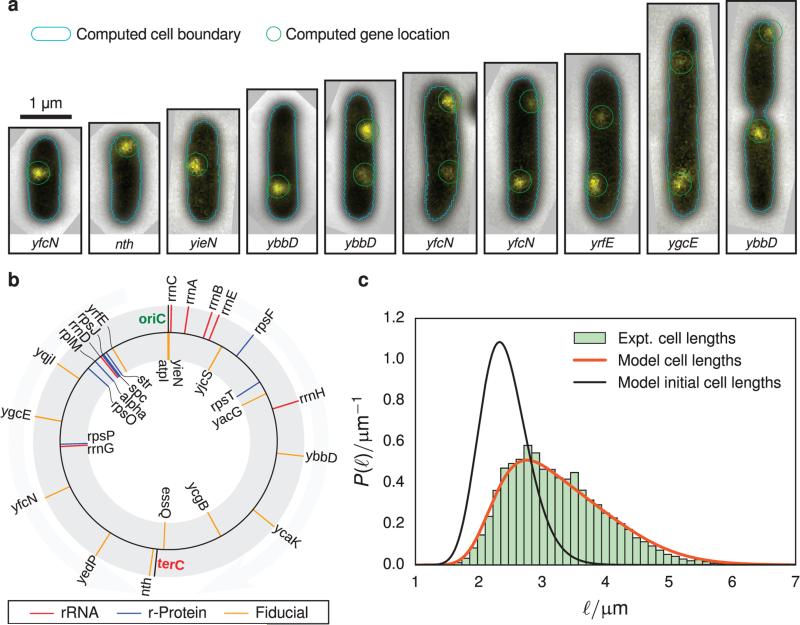
FIGURE 1.
(a) Composite phase-contrast and epifluorescence images of representative imaging data used to determine cell length and operon positioning. The cell boundaries (cyan) and operon locations (green) are determined computationally. Examples of rejected cells are presented in Figure S1 of the Supporting Information. (b) Diagram showing the position of labeled genes used to track DNA replication (fiducial, orange) and those involved in ribosome biogenesis (rRNA, red; ribosomal protein, blue). The black lines indicate the origin of replication (oriC) and the replication terminus (terC) (c) Abundance of cell lengths (green histogram) from imaging experiments are fitted to a simple exponential growth model (orange line, Equation 6) to estimate the average and variance of cell lengths after division (black line). Approximately 7600 cells are included in this histogram.

