
Figure 4.
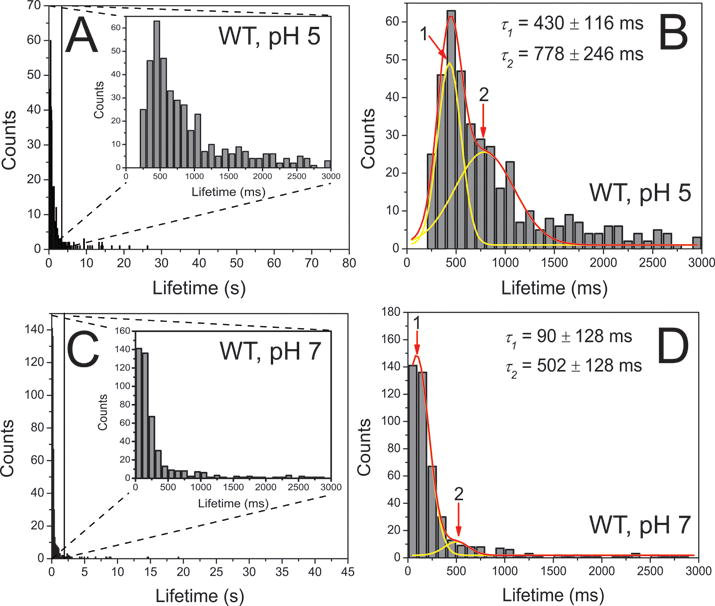
Quantitative analysis of the experiments with WT α-Syn dimers at pH 5 (A and B, n = 505) and at pH 7 (C and D, n = 462). The enlarged graphs show the majority of the fluorescence bursts spanning 0 and 3 s, as shown as insets to frame A and C. The corresponding major distribution is fitted with two-Gaussian (B and D). Red lines are global fitting curves, and yellow lines are deconvolution curves. The obtained fitting parameter are shown in mean ± SD. Numbers and arrows indicate each subpopulation, corresponding to each type of dimers.