
Figure 6.
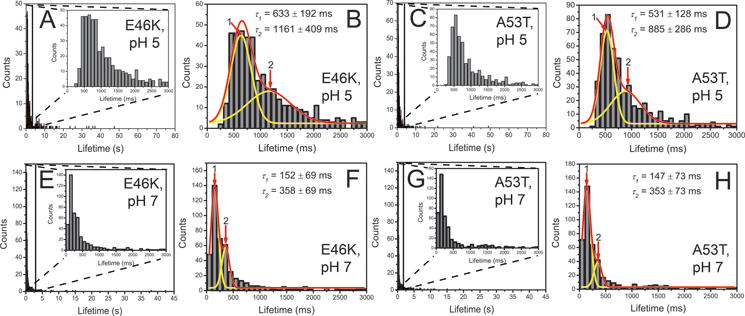
Quantitative analysis of the experiments with E46K and A53T α-Syn dimers at pH 5 (A and B for E46K, n = 524; C and D for A53T, n = 530) and at pH 7 (E and F for E46K, n = 460; G and H for A53T, n = 453). The enlarged graphs show the majority of the fluorescence bursts spanning 0 and 3 s, as shown as insets to frames A,C, E, and G. The corresponding major distribution is fitted with two-Gaussian (B, D, F, and H). Red lines are global fitting curves, and yellow lines are deconvolution curves. Numbers and arrows indicate each subpopulation, corresponding to each type of dimers. The obtained fitting parameter are shown in mean ± SD.