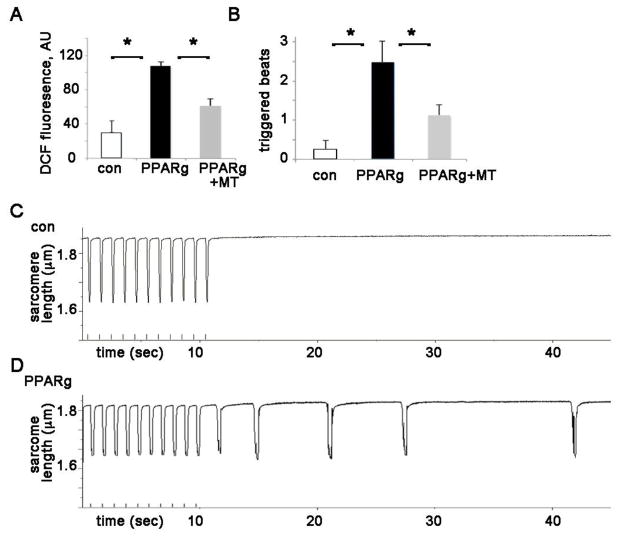
Figure 1. PPARg cardiomyocytes have increased ROS and triggered activity.
A. ROS in isolated cardiomyocytes; height is DCF fluorescence minus background. ROS is reduced by mitotempo in PPARg cardiomyocytes. MT = mitotempo 20 μM. The means are significantly different by ANOVA, *= sig different from control by post-hoc test. Readings were performed in triplicate with 2000 cells/well from 3 animals of each type.
B. Graph of triggered activity from PPARg and control cardiomyocytes. The means are significantly different by ANOVA, *= sig different from control by post-hoc test, n=21–35 cells from 3 animals of each type.
C. Representative example of isolated control cardiomyocyte, paced without subsequent activity
D. Representative example of isolated PPARg cardiomyocyte with triggered activity after pacing.

