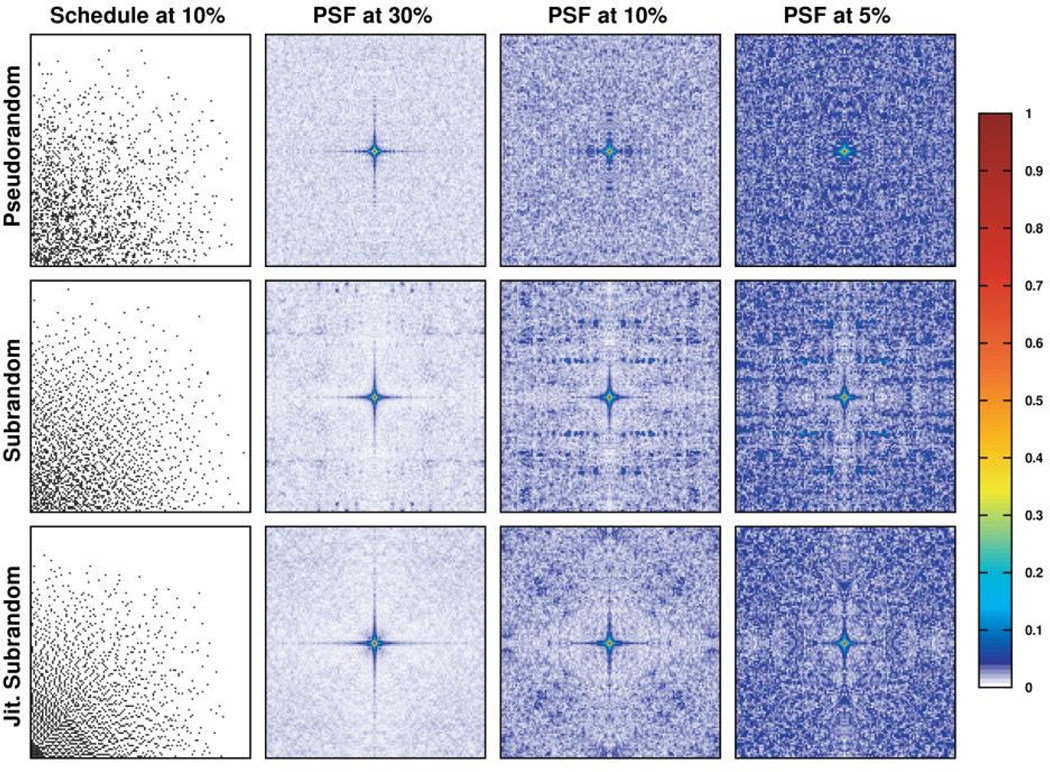
Figure 2.
Comparison of two-dimensional sinusoidally weighted pseudorandom, subrandom and jittered subrandom sampling schedules and their resultant point spread functions (PSFs) at various sampling densities. As sampling density decreases, the μPSF metric also increases, indicated by the appearance of more blue-shaded regions in the PSF. At all densities, and especially at 30%, the shape of the PSF fundamental (central region) matches exceedingly well between all three schedules. While subrandom rejection sampling produces substantial sidelobes as sampling density increases, jittered subrandom sampling does not, resulting in PSFs that closely resemble pseudorandom sampling.

