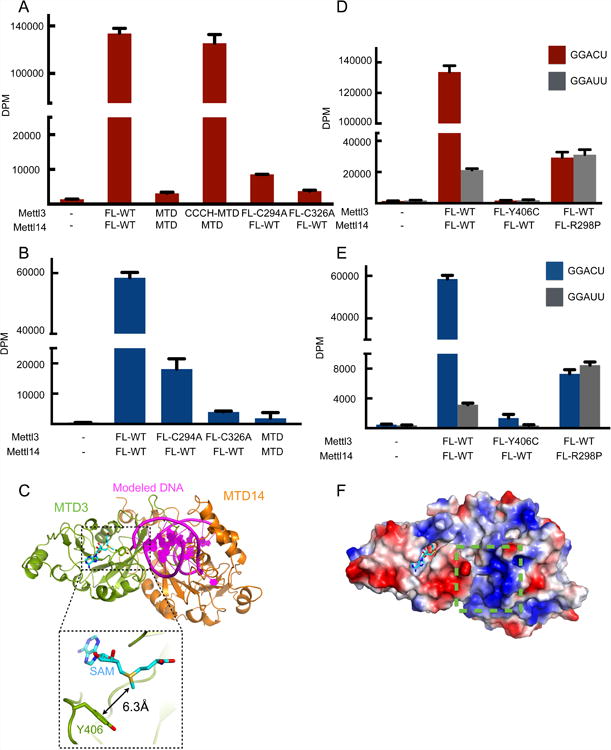
Figure 5. Proposed RNA substrate interactions with the Mettl3/Mettl14 complex.

(A) In vitro methyltransferase activity of the full-length Mettl3/Mettl14 complexes expressed in E. coli with indicated point mutations or truncations (MTD).
(B) In vitro methyltransferase activity of the full length Mettl3/Mettl14 complexes expressed in HEK293 cells with indicated point mutations. Data shown as mean +/- SD from three replicates.
(C) Modeling of the RNA binding site by superimposition of the mDNMT1-DNA complex structure (PDB: 4DA4) onto the MTD3/MTD14 complex. The modeled DNA substrate of the complex structure of mDNMT1-DNA is shown in purple, cartoon representation and MTD of mDNMT1 is omitted for simplicity. Close-up view (dashed rectangle) shows the Y406 residue 6.3Å from the methyl group of SAM (cyan sticks).
(D) In vitro methyltransferase activity of the full-length Mettl3/Mettl14 complexes expressed in E. coli with indicated point mutations. Data shown as mean +/- SD from three replicates.
(E) In vitro methyltransferase activity of the full length Mettl3/Mettl14 complexes expressed in HEK293 cells with indicated point mutations. Data shown as mean +/- SD from three replicates.
(F) Surface representation colored by vacuum electrostatic potential of the MTD3/MTD14 complex in the same orientation as in (C). The basic patch close to the modeled DNA is indicated by a green dashed box. SAM is shown in stick representation, colored in cyan.
See also Figure S6.
