Figure 5.
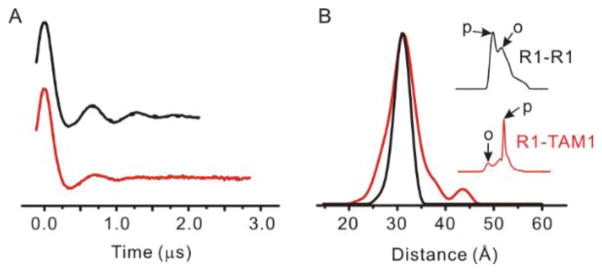
DEER data reveal the spatial localization of the TAM1 spin label. (A) The time domain signal of the 68C/109C mutant labeled with R1 (black trace) and with a R1-to-TAM1 ratio of 1:3 (red trace). (B) The distance distributions obtained from analysis of the DEER data in (A) for the R1-R1 (black) and R1-TAM1 (red) labeled mutants. The inset in (B) shows the field-swept electron spin echo spectra (200 G wide) at Q-band for the R1-R1 (black) and R1-TAM1 (red) labeled 68C/109C mutant. The arrows marked “p” and “o” indicate field positions of pump and observe pulses, respectively, for each experiment (see text).

