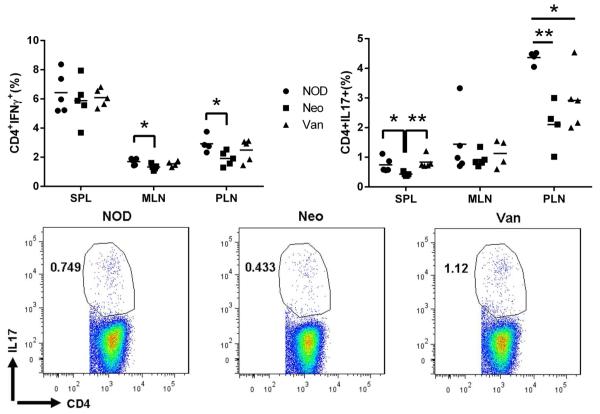
Fig. 8.
Th1 and Th17 profiling of T cells from mice adoptively transferred with diabetogenic T cells. NOD: NOD mice as recipients; Neo: Prenatal neomycin-treated mice as recipients; Van: Prenatal vancomycin-treated mice as recipients. IFNγ-expressing CD4 T cells (left) and IL17-expressing CD4 T cells (right). Representative FACS plots: IL17-expressing CD4 T cells from SPL. *: P<0.05, **: P<0.01 (Student’s t-test).

