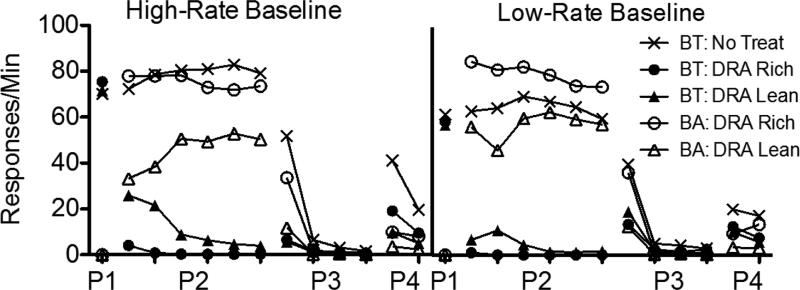
Fig. 1.
Target (BT) and alternative (BA) response rates across phases (P1-P4) of Experiment 1. Data are averaged across pigeons and aggregated into five-session blocks (response rates only from the last five sessions of Phase 1 are shown). The left panel includes data from the High-Rate baseline condition, and the right panel includes data from the Low-Rate baseline condition. Figures for individual subjects are in Appendices A1 and A2.

