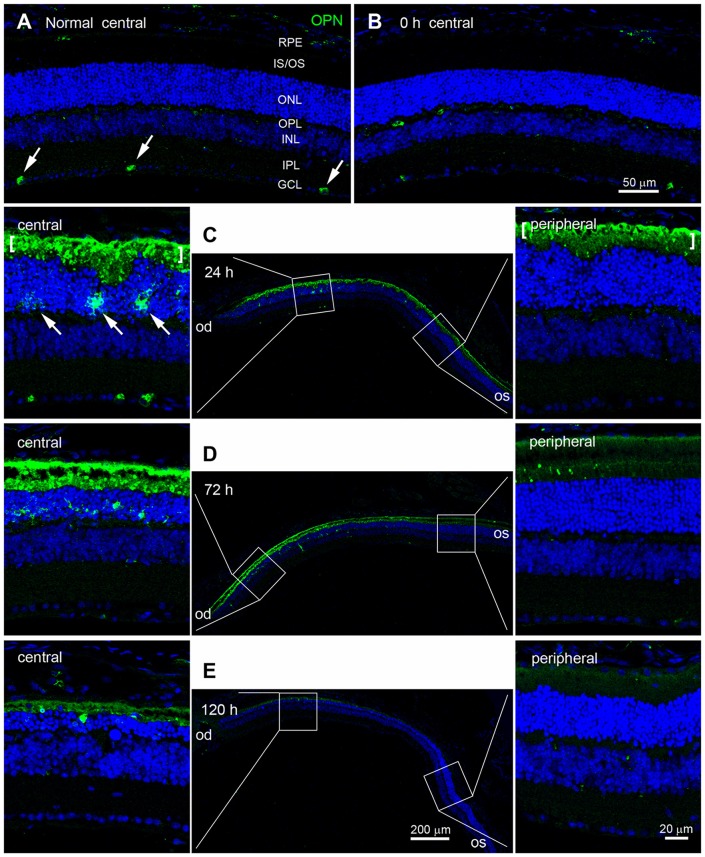
Figure 3.
Temporal and spatial profiles of OPN expression in blue LED-induced RD retinas. Confocal micrographs taken from vertical sections of blue LED-induced RD eyecups processed for OPN immunoreactivity. (A) A representative normal control retina. Several ganglion cells (arrows) in the GCL were weakly labeled with OPN. INL, inner nuclear layer; IPL, inner plexiform layer; IS/OS, inner segment and outer segment; ONL, outer nuclear layer; OPL, outer plexiform layer; RPE, retinal pigment epithelium. (B) A representative RD retina immediately after blue LED exposure (0 h). OPN expression was similar to that in the unexposed RD control. (C) A representative RD retina at 24 h after blue LED exposure. The central and mid-peripheral retina are magnified. Strong OPN immunoreactivity was observed in cells of the ONL (arrows) and in the subretinal space (bracket) in the central retina, but not in the peripheral retina. (D) A representative RD retina at 72 h after blue LED exposure. OPN expression was similar to that in the RD retina at 24 h after blue LED exposure; however, a relatively larger number of OPN-labeled cells were observed in the ONL of the central retina at this time point. OPN immunoreactivity in the subretinal space of the peripheral retina was negligible. (E) A representative RD retina at 120 h after blue LED exposure. OPN immunoreactivities in the ONL and subretinal space of the central retina were markedly decreased.

