FIGURE 6.

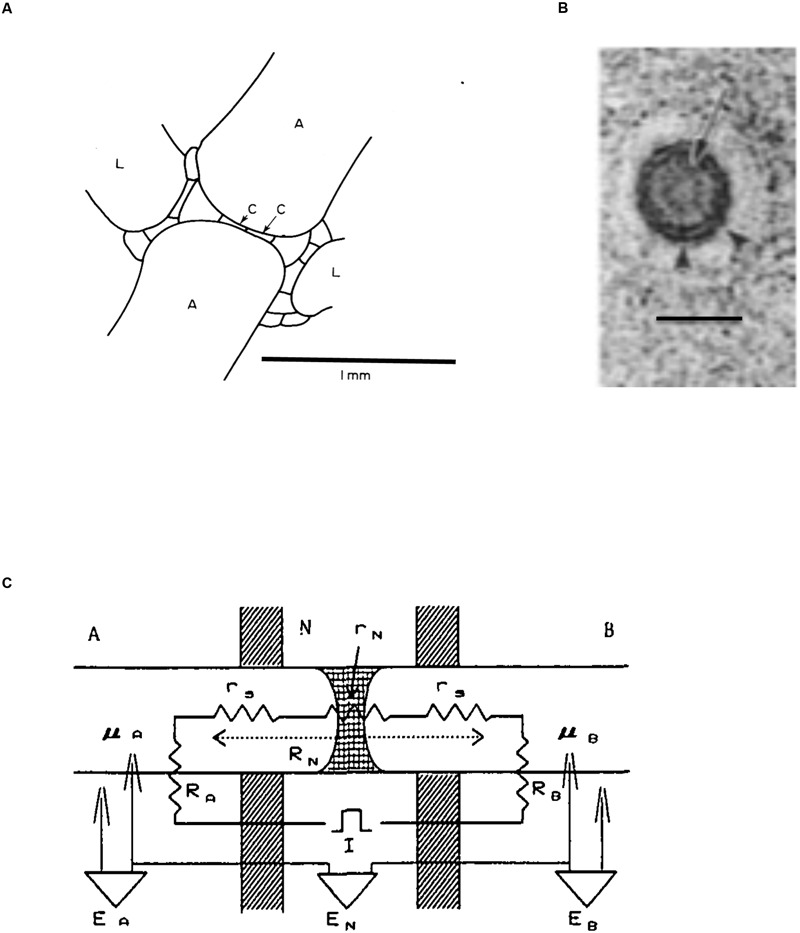
Structure of the nodal complex. (A) In this diagram of longitudinal section through the node of Chara the axial internodes are marked “A,” the lateral (leaf) internodes are marked “L” and the two central nodal cells are labeled “C.” (adapted from Walker and Bostrom, 1973). (B) Electron microscopy of transverse view of plasmodesma in a branch node of C. zeylanica. Arrow marks the central desmatubule, small arrowheads indicate the spoke structures connecting it to plasma membrane. Bar is 50 nm (from Cook et al., 1997). (C) The electrical model of the node and its neighboring internodes (Ding and Tazawa, 1989): RA is the membrane resistance of cell A, RB is the membrane resistance of cell B, RN is the resistance across the node, which is the sum of the node resistance rN plus the resistances of the cell sap rs. The PDs across cell A, cell B and the nodal region are EA, EB and EN, respectively. The internal electrodes are labeled μA and μB.
