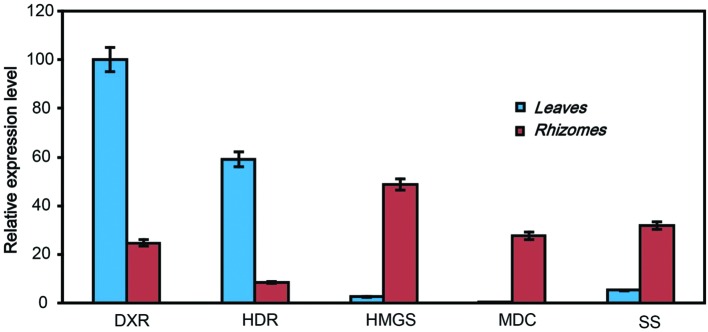
FIGURE 7.
qRT-PCR validation of the expressed genes in triterpenoid saponins biosynthetic pathway in Anemone flaccida. The blue and red bars indicated the genes expression from leaves or rhizomes, irrespectively. The y-axis indicated the expression levels of genes relative to that of the housekeeping gene EF1α. The result was the mean from three replicates, and error bars indicated the standard deviation.

