
Figure 4.
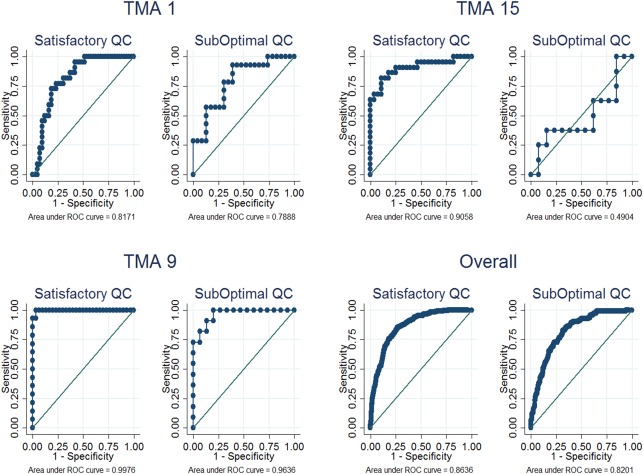
Graphs comparing the ROC curves for the discriminatory accuracy of the automated continuous scores against categories of the visual score by QC status among representative TMAs. The discriminatory accuracy was better among cores with satisfactory QC, overall and in TMAs 1 & 15. This difference was however not as obvious in TMA 9 as in 1 and 15.