Abstract
Background
Lung ultrasound (LUS) is a clinical imaging technique for diagnosing acute lung injury (ALI) and acute respiratory distress syndrome (ARDS). In humans and several large animals, LUS demonstrates similar specificity and sensitivity to computerized tomography (CT) scanning. Current study evaluated the degree of agreement between LUS and CT imaging in characterizing ALI/ARDS in rats.
Methods
Thirty male Sprague-Dawley rats were imaged by LUS before randomization into three groups to receive intratracheal saline, 3 or 6 mg/kg LPS respectively (n=10). LUS and CT imaging was conducted 2 hours after instillation. Cross table analyses and kappa statistics were used to determine agreement levels between LUS and CT assessments of lung condition.
Results
Before instillation, rats presented with a largely A-pattern in LUS images, however, a significantly increase B-lines were observed in all groups after instillation and showed dose response to LPS or to saline. One rat treated with 6 mg/kg lipopolysaccharide (LPS) presented with lung consolidation. The agreement between the LUS and the CT in detecting the main characteristics of ALI/ARDS in rat was strong (r=0.758, P<0.01, k=0.737).
Conclusions
In conclusion, LUS detects ALI/ARDS with high agreement with micro PET/CT scanning in a rat model, suggesting that LUS represents a positive refinement in rat ALI/ARDS disease models.
Keywords: Acute lung injury (ALI), acute respiratory distress syndrome (ARDS), lung ultrasound (LUS), computerized tomography (CT), refinement
Introduction
Computerized tomography (CT) is the gold standard method for diagnosing acute lung injury (ALI) and acute respiratory distress syndrome (ARDS) clinically. However, lung ultrasound (LUS) has been used for ALI/ARDS diagnoses with a similar sensitivity and specificity, while being a more accessible bedside technique (1,2). Therefore, LUS is now considered available alternative to chest CT to identify patients at risk of ALI/ARDS (3).
Micro X-ray CT is often used to diagnose ALI in rodent model (4). However, this equipment is expensive, requires extensive training, and radioactive which limits the use of multiple scans or tracing the progression of the disease. LUS has previously been applied for diagnosing ALI/ARDS in pigs (5) and cattle (6), but to date, none has reported its use in rats. Rodent models are vital tools for studying ALI/ARDS pathogenesis. Therefore the purpose of current study was to directly correlate the characterizations of ALI/ARDS provided by LUS and CT imaging in a lipopolysaccharide (LPS)-induced ALI rat model. These findings support the future use of LUS in the assessment rodent ALI/ARDS models.
Methods
Animals
Thirty, male, Sprague-Dawley rats (specific-pathogen-free, 250±23 g) were cared for and used in accordance with internationally established guidelines (7). The study was performed in accordance with the approval and guidelines from the Institutional Animal Care and Use Committee of Guangdong Provincial Hospital of Chinese Medicine, Guangzhou University of Chinese Medicine.
Materials and methods
Rats were anesthetized with pentobarbital sodium (i.p 50 mg/kg). Pressure transducer (Memscap AS, Australia) was used for monitoring systemic blood pressure and heart rate from carotid artery. Heated mat were used to maintain body temperature of 37 °C.
After baseline LUS images, Rats were randomized into three groups, receiving 2 mg/mL LPS E. coli serotype 055:B5 (3,000,000 endotoxin units/mg solid, Sigma Chemical, US) at 3 mg/kg, 4 mg/mL LPS at 6 mg/kg and saline intratracheally (n=8–10). LUS and echocardiographic images were obtained collected 2 hours after instillation using the VisualSonicsVevo® 2100 animal ultrasound echocardiography system (VisualSonicsInc, Canada) fitted with a cardiac probe (30 MHz).
LUS images were taken by bilateral scanning through the dorsal wall, with rats maintained in a supine position. Four scans were performed on each rat, one at the apex and base of each hemithorax (Figure S1). Imaging of each rat took almost 10 minutes. Scanning sites were marked using a drawing pen to ensure that the probe was placed at exactly the same anatomical point for each scan.
Images were taken by bilateral scanning through the dorsal wall and used to indicate normal, pulmonary edema, or lung consolidation, depending on the visualization of A and B lines (Figure S2). The A lines are repetitive horizontal artifacts parallel to the pleural line and arising from it, caused by the preponderance of air over liquid in the lung parenchyma (8,9). The B lines are defined as discrete laser-like vertical hyperechoic reverberation artifacts that arise from the pleural line (previously described as ‘‘comet tails’’), extending to the bottom of the screen without fading, and move synchronously with lung sliding (8,9). Lung consolidation was indicated by a subpleural echo-poor region, or region with tissue-like appearance (8,9).
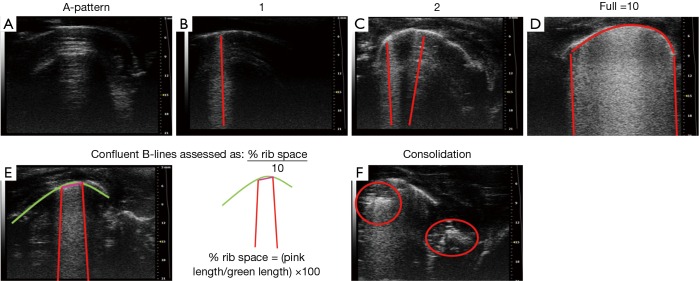
B-line score in all groups as determined by the number of B-lines from zero to ten at each intercostal space. When confluence, the percentage of rib space occupied by the B-lines was assessed and divided by ten. Thus, the B-line score can ranges from 0 to 10 per region, with a maximum of 40 per animal. Normal lung was defined as having 0–2 B-lines per image and pulmonary edema has 3 to 10 (Figure S2). Ultrasound pattern were evaluated by two physicians trained in chest sonography, and consensus was reached when there was disagreement.
Whole lung CT images from eight rats per group were taken using a Siemens InveonSomatom Sensation scanner (Siemens Corporation, NY). Lung density (n=8) were determined by mean and pixel-by-pixel Hounsfield units in individual tomographic slice, with 0 and −1,000 representing the density of water and air respectively. Whole-lung and 0.8-mm-thick segments at the apex and base of the lung were studied. To determine the agreement between LUS and CT scan, corresponding image slices were also graded as: normal, pulmonary edema and consolidation. A more complete CT image analysis is given in Figure S3, which shows a rightward shift in the lung density histograms in animals receiving LPS.
Terminal blood was used for the arterial blood oxygen pressure (PaO2). Lungs were fixed in 10% formaldehyde for 24 hours, before washed with water. Formalin-fixed lung was sectioned (5 µm) in a coronal fashion for histologic analysis (Figure S4).
Statistical analysis
Data presented as means ± SD. Statistics were performed using IBM SPSS version 19 software, analyzed by unpaired two-way t-test with Welch’s correction, kappa and cross-table or Spearman rank correlation for different purposes. P<0.05 as significantly.
Details methods will be available in supplementary.
Results
Baseline B-line score for all thirty rats was 0.52±0.57 which were categorized as normal. Saline control group has increased B-lines to 2.40±1.35 at 2 hours after instillation (P=0.0016 vs. baseline). LPS increased the appearance of B-lines bilaterally. 3 mg/kg LPS increased B-lines to an average of 11.10±4.53 per rat, while 6 mg/kg LPS increased to 20.10±6.62 (P<0.0001 vs. saline) (Figure 1). Post-instillation decrease in arterial pressure and PaO2/FiO2 were observed in LPS groups until the end of the experiment (P<0.0001 vs. saline treated) (Table 1).
Figure 1.
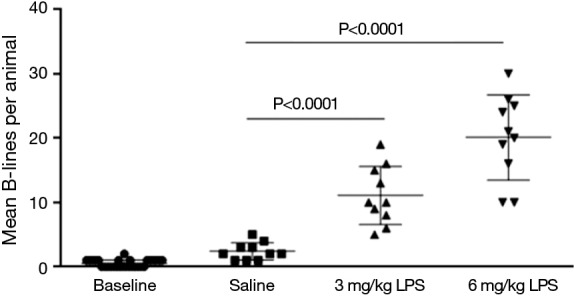
Mean B-lines per rat pre-stimulation and 2 hours after instillation of saline, 3 or 6 mg/kg LPS. LPS, lipopolysaccharide.
Table 1. Vital signs 2 hours after instillation of saline, 3 or 6 mg/kg LPS.
| Vital signs | Variable ± SD | ||
|---|---|---|---|
| Saline (n=10) | LPS (3 mg/kg) (n=10) | LPS (6 mg/kg) (n=10) | |
| Heart rate, bpm | 420±17 | 390±72 | 382±63 |
| Systemic blood pressure, mmHg | 118±15 | 68±10a | 61±8a |
| PaO2/FiO2 index | 524±56 | 280±16a | 212±12a |
| Mean B-lineper animal | 2.40±1.35 | 11.10±4.53a | 20.10±6.62a |
a, P<0.0001 vs. saline. LPS, lipopolysaccharide; SD, standard deviation.
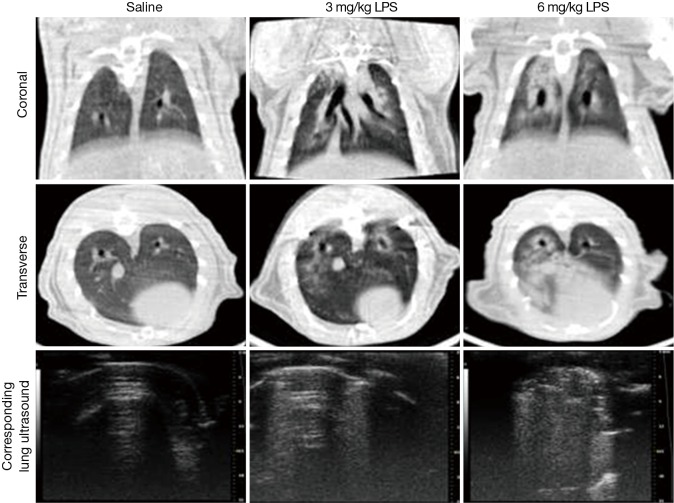
Micro PET/CT images showed an increase in lung density after receiving 3 or 6 mg/kg LPS (Figures 2,S2). Images from rats receiving 3 mg/kg LPS indicated air volume loss, which was replaced by exudates. Lung density appeared further increased in rats receiving 6 mg/kg LPS as lung consolidation with air bronchograms.
Figure 2.
Examples of micro X-ray computed tomography scans and corresponding sonography images. No specific aspects of the images have been enhanced. The first column is the saline group. And the middle column is the 3 mg/kg LPS group, the last column is the 6 mg/kg group.
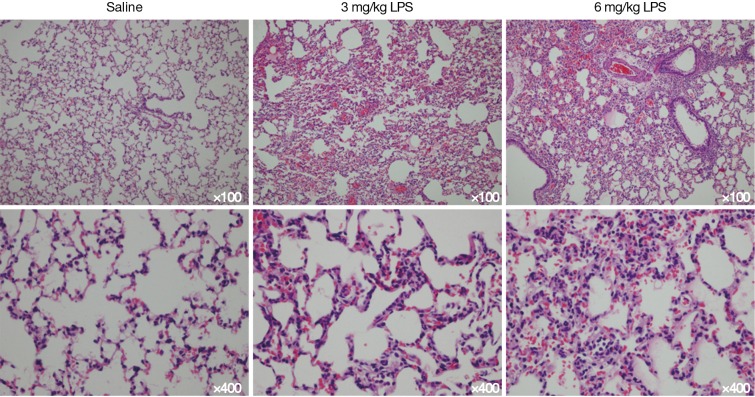
The correlation between the LUS and CT image grading was strong (Table 2). Healthy lungs with a pattern of A-lines by LUS, were confirmed with CT imaging. B-lines identified by LUS corresponded to interstitial exudation, and tissue-like appearance in LUS was confirmed as lung consolidation by CT imaging. Spearman rank correlation analysis on the categorized lung images (normal, pulmonary oedema and lung consolidation) produced a value of 0.758, with a kappa of 0.737, indicating strong agreement between CT and LUS images in diagnosis the three main characteristics of ALI/ARDS in rats. The grading of ALI/ARDS was further confirmed histologically, with mild to moderate interstitial and alveolar edema with leukocyte infiltration in all LPS-treated lungs. Inflammatory cell infiltration was seen at LPS groups with severe pulmonary hemorrhagic edema but not in saline group.
Table 2. Classification of lung condition by ultrasound (LUS) versus computerized tomography (CT). Eight animals each contributed eight LUS and eight corresponding CT images. So the total image type is 96 (8 rats ×4 parts/rat ×3 grades/part). The kappa for the level of agreement between LUS and CT was 0.737, which represents a strong correlation.
| CT images | LUS images | Total | ||
|---|---|---|---|---|
| Normal | Edema | Consolidation | ||
| Normal | 60 | 2 | 0 | 62 |
| Edema | 13 | 20 | 0 | 33 |
| Consolidation | 0 | 0 | 1 | 1 |
| Total | 73 | 22 | 1 | 96 |
LUS, lung ultrasound; CT, computerized tomography.
Discussion
This study provides experimental evidence for the use of LUS as a replacement for chest CT to characterize ALI/ARDS in rats. Intratracheal instillation changed the appearance of LUS images from that of an A-line pattern, to that including B-lines. The number of B-lines increased with the dose of LPS, and was significantly higher than in rats who received saline.
B-lines are characteristic of ALI/ARDS in humans and larger animal species. The appearance of B-lines was consistent with pulmonary edema, as observed in chest CT images. The appearance of B-lines was proportional to LPS dose and the severity of ALI, with one rat receiving the high dose (6 mg/kg) of LPS presented with lung consolidation. The increasing severity of lung inflammation and edema with LPS dose was further confirmed by pathological examination and lung density calculations.
LUS is a safe, noninvasive, simple tool for detecting fluid accumulation in the lung. Various clinical studies have demonstrated a strong correlation between LUS examinations and other techniques used to measure elevated extravascular lung water, including radiography (10), quantitative CT (11), invasive methods of lung water estimation and hydrostatic pressure measurements estimation (12-14). Animal experiments have also demonstrated the accuracy of LUS compared to other methods of measuring extravascular lung water in pigs (5) and bovines (6). LUS is now considered to have similar diagnostic capacity for ALI/ARDS as chest CT, which is the gold standard method for clinical detection.
The current study is the first to show that LUS is also highly correlated with CT findings for the diagnosis of ALI/ARDS in rats. We propose that the detection of B-lines and consolidation using transthoracic LUS is a simple, minimally invasive, fast throughput method which is cheaper to obtain and could be used to refine the detection of ALI/ARDS in pre-clinical rodent models. LUS was well-tolerated in rats with ARDS because all scans could be performed in a supine position and over a relatively short period of time (performed in an average of 8 minutes), representing clear benefits compared with CT scanning. Furthermore, LUS also allows mechanical ventilation in cases of severe animal sickness, which may not be possible during a CT scan.
Specific applications of LUS may include dynamically monitoring of the response to treatment (15) and excluding other causes of acute respiratory distress in the emergency setting, such as heart failure (16), pneumothorax (14), pleural effusion (17), alveolar pneumonia (18).
There are some limitations to the use of LUS in the setting of ALI. LUS has a limited ability to differentiate lung pathology compared with CT imaging, as it is a surface-imaging technique. Pathology that is not in the lung periphery may be missed by LUS, furthermore, although we could distinguish the severity of pulmonary edema by the increasing number of B-lines in the current study, such a correlation would not be possible with a less homogenous pathology. These factors are also applicable to the use of LUS for diagnostic lung imaging in humans, where it should be noted that B-lines can be a result of pulmonary fibrosis (19); an effect which may also occur in animal models.
In conclusion, LUS imaging showed a strong correlation with CT findings for the diagnosis of ALI/ARDS in rodents, with increasing numbers of B-line indicating progressive edema severity. As is already in practice in humans and large animal species medicine, we propose that LUS represents is a more practical and less invasive technique which could be used as a replacement for CT in the study of ALI/ARDS in rodents.
Acknowledgements
Funding: This work was supported by grant from Guangdong Provincial Department of Science and Technology-Guangdong Provincial Academy of Medicine joint research projects, Guangdong, China (Grant number: 2011B032200006).
Supplementary
Animals
Thirty, male, Sprague-Dawley rats [Rattus, Rattus, specific-pathogen-free, 250±23 g (standard deviation)] were used for this study, conducted at Animal Experiment Center, Southern Medical University and performed in accordance with the approval and guidelines of the Institutional Animal Care and Use Committee of Guangdong Provincial Hospital of Traditional Chinese Medicine, Guangzhou University of Traditional Chinese Medicine. Animal were cared for and used in accordance with internationally established guidelines (7).
Materials and methods
Rats were anesthetized with intraperitoneal (i.p.) pentobarbital sodium (50 mg/kg) and the left carotid artery cannulated so that systemic arterial blood pressure and heart rate could be measured using a physiological pressure transducer (Memscap AS, Cleveland, North Carolina, US./Power Lab, AD Instruments Pty Ltd, Australia). Rats were maintained on a heated mat throughout the experiment, with monitoring to ensure an internal body temperature of 37 °C.
Baseline LUS images were collected after anesthesia. Rats were then randomly separated into three groups: two ALI groups (n=10 for each), one group received intratracheal 2 mg/mL LPS E. coli serotype 055:B5 (3,000,000 endotoxin units/mg solid, Sigma Chemical, St. Louis, Missouri, US) at 3 mg/kg and the other received intratracheal 4 mg/mL LPS at 6 mg/kg, while controls animals (n=10) were intratracheally instilled with the same volume of isotonic saline solution (NaCl). Instillation was given through the anterior tracheal wall using a 22-gauge angiocatheter, after which the trachea was flushed with 5 mL air to clear the central airway. The skin overlying the trachea was then sutured. Following this, rats were held upright and rotated by hand to ensure good distribution of fluid within the lungs. Additional pentobarbital sodium (25 mg/kg, i.p.) was administered every 45 min to provide a constant depth of anesthesia, as monitored by the animal’s cardiorespiratory, electrographic and reflex responses. Further LUS and CT images were collected 2 hours after instillation. One operator collected all of the LUS and CT images, which another operator later graded.
LUS and echocardiographic images were obtained using the VisualSonicsVevo® 2100 animal ultrasound echocardiography system (VisualSonicsInc, Toronto, Ontario, Canada) fitted with a cardiac probe (15–21 MHz). Images were taken by bilateral scanning through the dorsal wall, with rats maintained in a supine position. Four scans were performed on each rat, one at the apex and base of each hemithorax (Figure S1). Imaging of each area took less than 10 minutes. Scanning sites were marked using a drawing pen to ensure that the probe was placed at exactly the same anatomical point for each scan.
LUS was used to indicate three lung statuses depending on the visualization of A and B lines; normal, pulmonary oedema, and lung consolidation. Normal lung consisted of A-lines/A pattern; repetitive horizontal artifacts occurring parallel to, and arising from, the pleural line, caused by the preponderance of air over liquid in the lung parenchyma (20). Pulmonary oedema was indicated by B-lines, defined as discrete laser-like vertical hyperechoic reverberation artifacts that arise from the pleural line, extend to the bottom of the screen without fading, and move synchronously with lung sliding (8). Lung consolidation was indicated by a subpleural echo-poor region, or region with tissue-like appearance (10) (Figure S2). B-lines are artifacts, and can also appear in normal lungs. To grade each image, a B-line score was determined by counting the number of B-lines from zero to ten at each intercostal space. In cases of confluence, the percentage of rib space occupied by the B-lines was assessed and divided by ten. Thus, the B-line score of each scan can range from 0 to a maximum of 10 for each region, with a maximum of 40 per animal. A-pattern (the normal lung), was defined as having 0–2 B-lines per image. B-pattern (pulmonary oedema) was defined as 3 to 10 B-lines per image (Figure S2).
CT images of whole lungs were obtained from eight randomly selected rats in each group using a Siemens InveonSomatom Sensation scanner (80 kv, 500 mAs, Siemens Corporation, New York, NY, USA). Image reconstruction was performed using the Inveon Research Workplace. Lung density measurements were made for eight randomly selected rats per group by recording mean and pixel-by-pixel Hounsfield units in one single tomographic slice, with 0 representing the density of water and −1,000 representing the density of air. Whole-lung and 0.8-mm-thick segments at the apex and base of the lung were studied. To determine the agreement of LUS results with those of the CT scan, corresponding image slices were graded using the same categories: normal, pulmonary oedema and consolidation. A more complete CT image analysis is given (Figure S3), which shows a rightward shift in the lung density histograms in animals receiving LPS. CT images were evaluated by both the CT Hu levels and two technicians trained in micro X-ray CT, and consensus was reached when there was disagreement.
At the end of the experiment, abdominal aortic blood was collected to measure the arterial blood oxygen pressure (PaO2) and histology was performed on lung samples. Lungs were collected at the end of the experiment and fixed in 10% formaldehyde for 24 hours, then washed with water. Using standard histologic techniques, the foRMALIN-fixed lung was serially sectioned (5 µm) in a coronal fashion, and six random sections were processed for histologic analysis using hematoxylin and eosin staining (Figure S4).
Continuous data were summarized as means ± standard deviation (SD). Statistical analyses were performed using IBM SPSS version 19 software. Differences in the vital signs, and the in the number of B-lines per animal of the control and experimental groups were examined using an unpaired two-way t-test with Welch’s correction, with P values less than 0.05 considered significant. The agreement between the LUS and the CT images were examined by kappa statistics and cross-table analysis. Spearman rank correlation analysis was used to assess the diagnostic value of LUS compared to CT scan, with significance was accepted at P less than 0.05.
Figure S1.
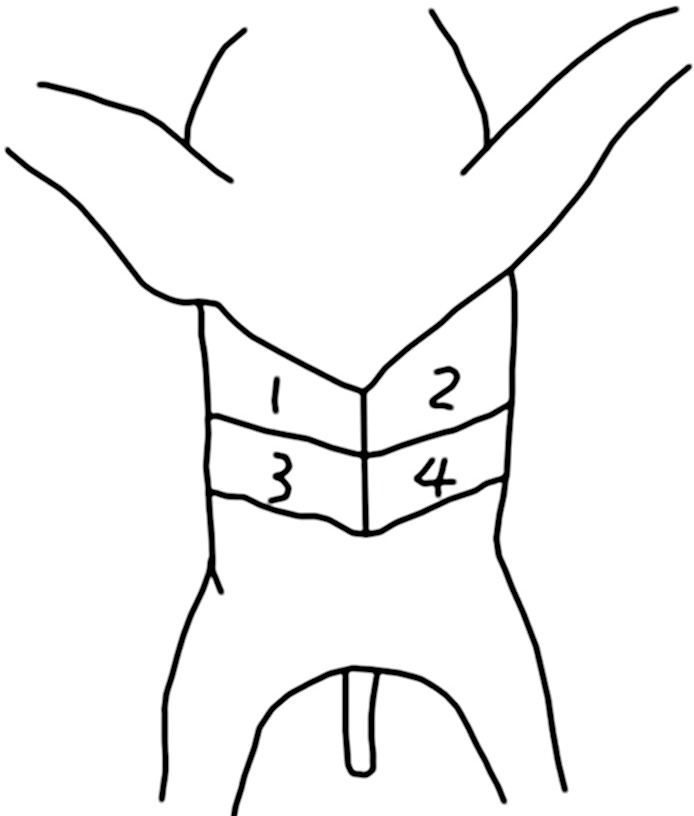
The four pre-defined scanning sites on the rat’s posterior wall.
Figure S2.
Examples of B line scoring in lung ultrasound images. (A) It stand for A-pattern, there is no B lines, so the B line score is 0; (B) only one B line can be seen, so the B line score is 1 (one red line); (C) two B lines are can be seen, so the B line score is 2 (two red line); (D) there are full B lines arise from the whole pleural line, so the B line score is 10 (the red arc-shaped line: pleural line, the red straight line: B line); (E) there are confluence B lines, so the B line score = the percentage of pleural line occupied by the B-lines ×10, the B line score = red line/green line ×10=0.6 cm/3 cm ×10=2 (the green arc-shaped line: pleural line, the red straight line: B line); (F) it stands for lung consolidation.
Figure S3.
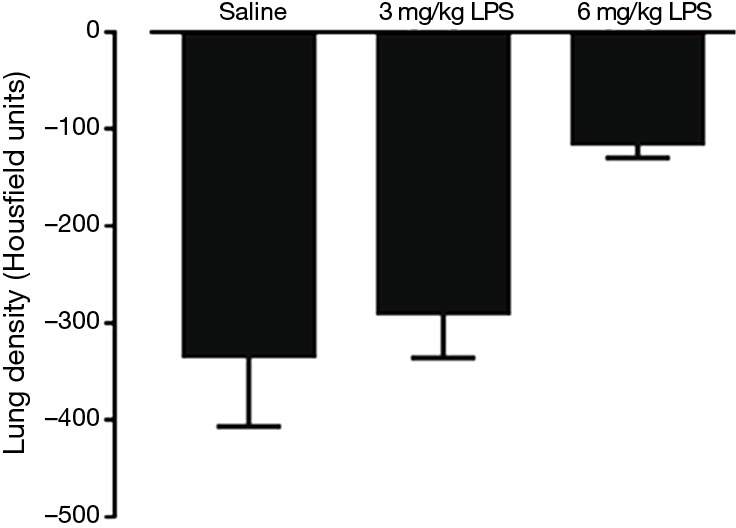
Mean lung density, measured by microPET/CT from a single tomographic slice. n=8 rats per group. 0= density of water and −1,000= density of air.
Figure S4.
Lung histology with haematoxylin and eosin staining. No specific aspects of the images have been enhanced.
Ethical Statement: The study was performed in accordance with the approval and guidelines from the Institutional Animal Care and Use Committee of Guangdong Provincial Hospital of Chinese Medicine, Guangzhou University of Chinese Medicine.
Footnotes
Conflicts of Interest: The authors have no conflicts of interest to declare.
References
- 1.Rajan GR. Ultrasound lung comets: a clinically useful sign in acute respiratory distress syndrome/acute lung injury. Crit Care Med 2007;35:2869-70. 10.1097/01.CCM.0000288094.70325.E4 [DOI] [PubMed] [Google Scholar]
- 2.Antonelli M, Azoulay E, Bonten M, et al. Year in review in Intensive Care Medicine 2010: III. ARDS and ALI, mechanical ventilation, noninvasive ventilation, weaning, endotracheal intubation, lung ultrasound and paediatrics. Intensive Care Med 2011;37:394-410. 10.1007/s00134-011-2136-1 [DOI] [PMC free article] [PubMed] [Google Scholar]
- 3.Peris A, Tutino L, Zagli G, et al. The use of point-of-care bedside lung ultrasound significantly reduces the number of radiographs and computed tomography scans in critically ill patients. Anesth Analg 2010;111:687-92. 10.1213/ANE.0b013e3181e7cc42 [DOI] [PubMed] [Google Scholar]
- 4.Zhou Z, Kozlowski J, Schuster DP. Physiologic, biochemical, and imaging characterization of acute lung injury in mice. Am J Respir Crit Care Med 2005;172:344-51. 10.1164/rccm.200503-343OC [DOI] [PMC free article] [PubMed] [Google Scholar]
- 5.Jambrik Z, Gargani L, Adamicza A, et al. B-lines quantify the lung water content: a lung ultrasound versus lung gravimetry study in acute lung injury. Ultrasound Med Biol 2010;36:2004-10. 10.1016/j.ultrasmedbio.2010.09.003 [DOI] [PubMed] [Google Scholar]
- 6.Corradi F, Ball L, Brusasco C, et al. Assessment of extravascular lung water by quantitative ultrasound and CT in isolated bovine lung. Respir Physiol Neurobiol 2013;187:244-9. 10.1016/j.resp.2013.04.002 [DOI] [PubMed] [Google Scholar]
- 7.National Research Council. Guide for the Care and Use of Laboratory Animals. Washington, DC: The National Academies Press, 1996. [Google Scholar]
- 8.Volpicelli G, Elbarbary M, Blaivas M, et al. International evidence-based recommendations for point-of-care lung ultrasound. Intensive Care Med 2012;38:577-91. 10.1007/s00134-012-2513-4 [DOI] [PubMed] [Google Scholar]
- 9.Lichtenstein DA, Mezière GA, Lagoueyte JF, et al. A-lines and B-lines: lung ultrasound as a bedside tool for predicting pulmonary artery occlusion pressure in the critically ill. Chest 2009;136:1014-20. 10.1378/chest.09-0001 [DOI] [PubMed] [Google Scholar]
- 10.Wang XT, Liu DW, Zhang HM, et al. The value of bedside lung ultrasound in emergency-plus protocol for the assessment of lung consolidation and atelectasis in critical patients. Zhonghua Nei Ke Za Zhi 2012;51:948-51. [PubMed] [Google Scholar]
- 11.Baldi G, Gargani L, Abramo A, et al. Lung water assessment by lung ultrasonography in intensive care: a pilot study. Intensive Care Med 2013;39:74-84. 10.1007/s00134-012-2694-x [DOI] [PubMed] [Google Scholar]
- 12.Picano E, Frassi F, Agricola E, et al. Ultrasound lung comets: a clinically useful sign of extravascular lung water. J Am Soc Echocardiogr 2006;19:356-63. 10.1016/j.echo.2005.05.019 [DOI] [PubMed] [Google Scholar]
- 13.Jambrik Z, Monti S, Coppola V, et al. Usefulness of ultrasound lung comets as a nonradiologic sign of extravascular lung water. Am J Cardiol 2004;93:1265-70. 10.1016/j.amjcard.2004.02.012 [DOI] [PubMed] [Google Scholar]
- 14.Volpicelli G, Boero E, Sverzellati N, et al. Semi-quantification of pneumothorax volume by lung ultrasound. Intensive Care Med 2014;40:1460-7. 10.1007/s00134-014-3402-9 [DOI] [PubMed] [Google Scholar]
- 15.Bataille B, Rao G, Cocquet P, et al. Accuracy of ultrasound B-lines score and E/Ea ratio to estimate extravascular lung water and its variations in patients with acute respiratory distress syndrome. J Clin Monit Comput 2015;29:169-76. 10.1007/s10877-014-9582-6 [DOI] [PubMed] [Google Scholar]
- 16.Trovato GM, Catalano D, Sperandeo M. Echocardiographic and lung ultrasound characteristics in ambulatory patients with dyspnea or prior heart failure. Echocardiography 2014;31:406-7. 10.1111/echo.12518 [DOI] [PubMed] [Google Scholar]
- 17.Prina E, Torres A, Carvalho CR. Lung ultrasound in the evaluation of pleural effusion. J Bras Pneumol 2014;40:1-5. 10.1590/S1806-37132014000100001 [DOI] [PMC free article] [PubMed] [Google Scholar]
- 18.Reissig A, Copetti R. Lung ultrasound in community-acquired pneumonia and in interstitial lung diseases. Respiration 2014;87:179-89. 10.1159/000357449 [DOI] [PubMed] [Google Scholar]
- 19.Hasan AA, Makhlouf HA. B-lines: Transthoracic chest ultrasound signs useful in assessment of interstitial lung diseases. Ann Thorac Med 2014;9:99-103. 10.4103/1817-1737.128856 [DOI] [PMC free article] [PubMed] [Google Scholar]
- 20.Sperandeo M, Rotondo A, Guglielmi G, et al. Transthoracic ultrasound in the assessment of pleural and pulmonary diseases: use and limitations. Radiol Med 2014;119:729-40. 10.1007/s11547-014-0385-0 [DOI] [PubMed] [Google Scholar]


