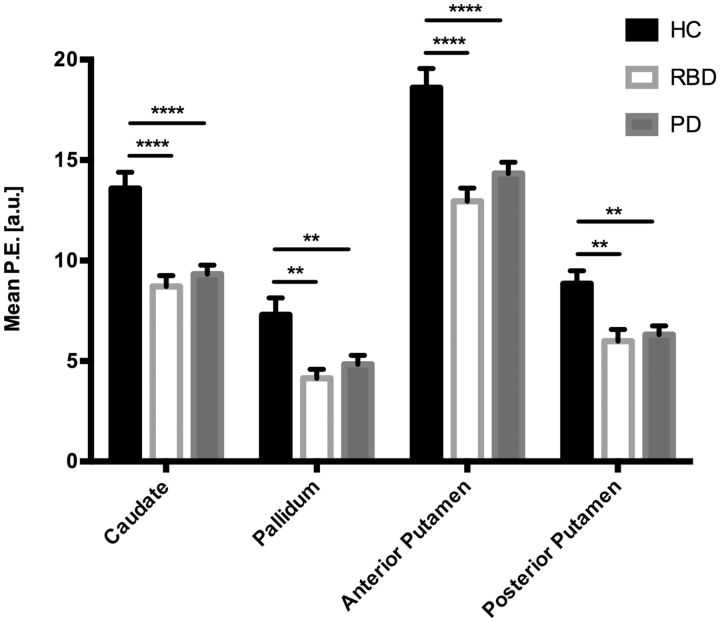
Figure 3.
Mean parameter estimates extracted from anatomical regions. The mean parameter estimate (P.E.) values were significantly lower in both the Parkinson’s disease and RBD groups, when compared to the healthy control group, in all four areas tested. There was no significant difference in any of the regions when RBD patients were compared to those with established Parkinson’s disease. The bars represent the group mean and the standard error of the mean. P-values corrected using Dunnett’s multiple comparison test. *P < 0.05; **P < 0.01; ***P < 0.001; ****P < 0.0001.

