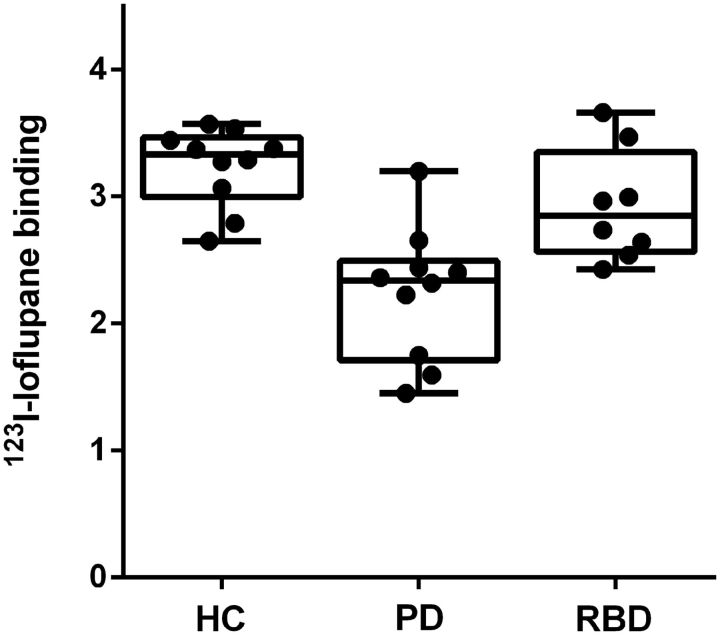
Figure 4.
123I–ioflupane binding in the lowest putamen of control, Parkinson’s disease and RBD subjects. Each boxplot represents (from bottom to top) quartile 1, median, and quartile 3, with whiskers representing the minimum and maximum 123I–ioflupane binding for the group. HC = healthy controls; PD = Parkinson’s disease.

