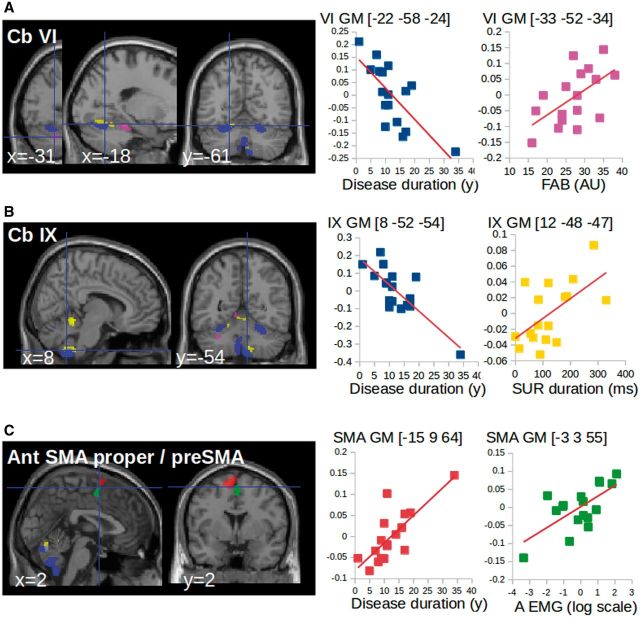
Figure 2.
Correlation of VBM changes with clinical scores and tremor severity. (A and B) Multiple regression showing that grey matter volume in the cerebellum correlated negatively with disease duration (blue) and positively with clinical scores [SUR = stand upright station (yellow), FAB = Fullerton Assessment of Balance (magenta)]. (C) Multiple regression showing that grey matter volume in the SMA correlated positively with disease duration (red) and tremor characteristics (green). A = area of the tremor power spectrum measured from EMG recordings). The clusters are superimposed on the SPM canonical brain. The cerebral parameters (individual values) showing the correlations with clinical parameters were calculated voxel-by-voxel in the regions of interest of cerebello-thalamo-cortical network (see regions of interest definition). Graphics are used as a display to report data dispersion and the direction of the correlation. GM = grey matter.

