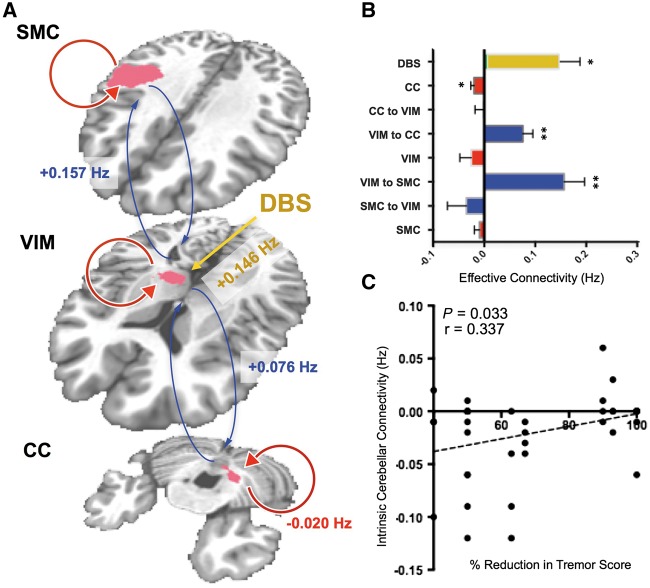
Figure 4.
Dynamic causal modelling results. (A) Excitatory interregional (blue arrows) and inhibitory within-region (red arrows) connections between sensorimotor cortex (SMC), motor thalamus (VIM), and contralateral cerebellum (CC), and the driving effect of DBS on VIM yellow are shown overlaid on the group DBS-evoked activation map. Connectivity parameters significantly different from zero are shown in A, and the estimated values for all connectivity parameters are shown in B (*P < 0.05, **P < 0.001). (C) A significant correlation (P < 0.05) was observed between within-region inhibitory connectivity in contralateral cerebellum and percent reduction in contralateral tremor score.

