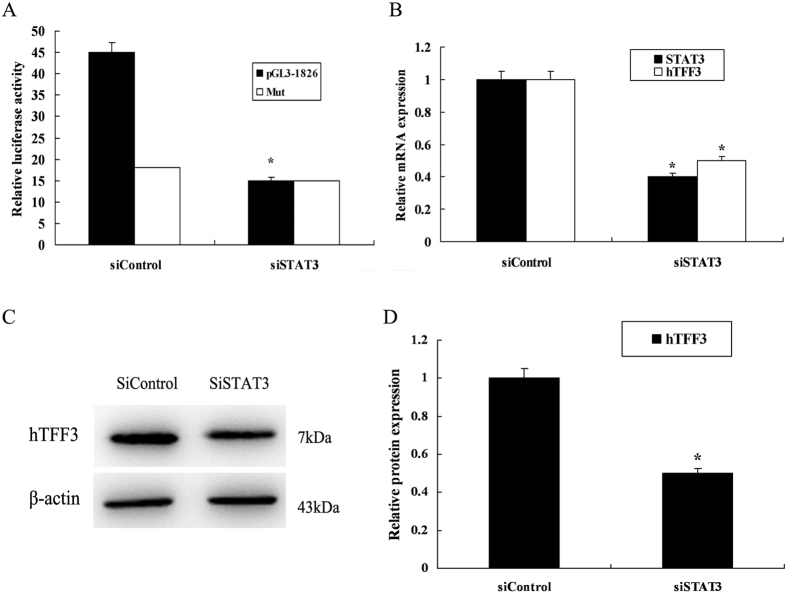
Figure 6. The effect of STAT3 knockdown on hTFF3.
pGL3−1826 or mutant pGL3−1826, and STAT3 siRNA were co-transfected into LS174T cells, and hTFF3 were added at 24 h post-transfection, followed by continuous culture for 24 h. (A) Detection of relative fluorescence intensity. (B) Real-time analysis of STAT3 and hTFF3 mRNA levels. (C,D) Western blot analysis of hTFF3 protein levels. Data are presented mean ± S.D. (*P < 0.05 compared with the sample expressing pCDNA3.1).

