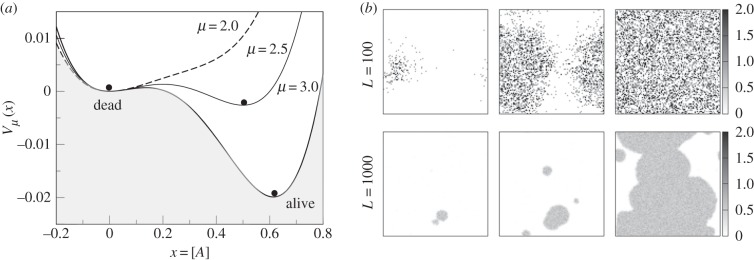
Figure 6.
(a) Phase transition from death to living states. Using the simple model described in §3, a potential function shows the phase change that occurs once the cooperation parameter μ crosses a given threshold. (b) Phase transition in a synthetic RNA world with molecular cooperation on a two-dimensional space. Snapshots of the catalytic polymer concentration in the RNA polymerization model at the beginning (left), during (centre) and after (right) the transition from the dead state to the living state for different system sizes (L = 102, 103) and with local hopping rules. Adapted from Wu & Higgs [59].

