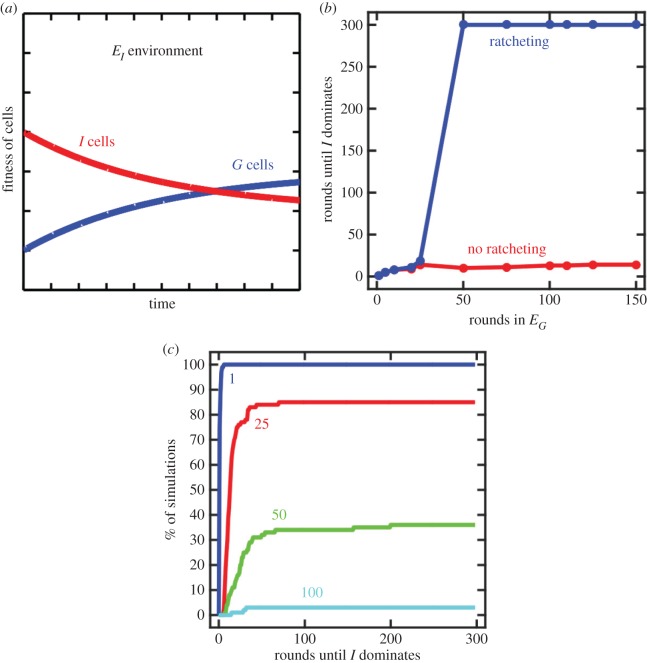
Figure 3.
The case when I cells become less fit than G cells in the EI environment. (a) As a result of G cells evolving in an EG environment, the evolution of ratcheting traits drives the fitness of I cells in EI below G cells. (b) The consequence of this is that once such mutations fix, there is no selective benefit for G cells to revert back to I cells even when grown in an EI environment. The time it takes for I cells to occupy 99% of the population is shown by the blue curve. Each point is the median of 100 simulations. Simulations were run for only 300 rounds so a value of 300 means that G cells are present for the entire duration of the simulation. For comparison, the red curve shows the case without type 1 ratcheting mutations. (c) An empirical cumulative distribution function plot shows the variation in the stability of multicellularity for different durations of growth in EG. The value of each curve at 300 shows the percentage of simulations in which I cells eventually dominated the population. Those that do not reach 100 correspond to simulations in which G cells remained present.

