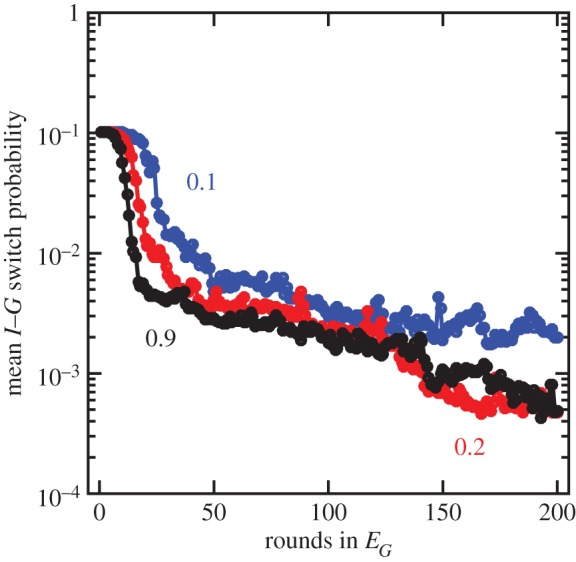
Figure 4.

Selection for lower probability of switching. The probability of switching between I and G cells is shown as a function of the number of rounds grown in EG. Each curve is the median of 10 evolved simulations and colours correspond to different c values—fitness differences between I and G cells—such that blue is c = 0.1, red is c = 0.2 and black is c = 0.9. All populations evolve lower probabilities of switching, starting at p = 10−1 and evolving close to p = 10−3, which is the same value as the probability that a mutation changes the probability of switching.
