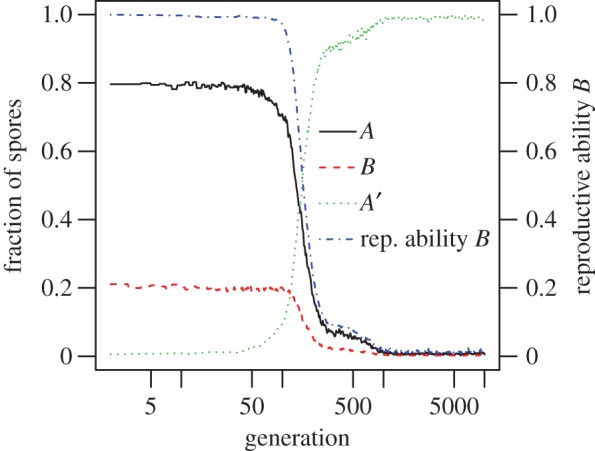
Figure 4.

Evolution of a germline. At generation 1 epimutation A′ was introduced. A series of mutations caused the reproductive ability of B to decline to almost 0. The A′ is equivalent to a germline at the end of the run, and B soma. NA = 4, NB = 1. f = 1, f′ = 1.3, k = 4, L = 0.5 population size is 103. Graphs show proportion of spores of the different types over time, and the average reproductive ability of B over time. Shown are results of one typical run.
