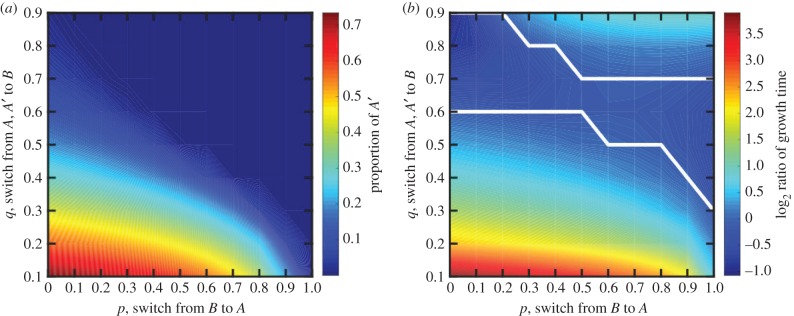
Figure 7.
The effect of A′ in a continuous population. (a) The proportion of A′ in the stabilized population (after repeated growth and bottlenecks) is shown as a function of switch rates between types. Here, A′ has a fitness advantage of s = 1 over A types. The proportion of A′ is greater than 0 for all values tested though it is the highest when switching between phenotypes is infrequent. (b) The log2 ratio of times it takes populations to reach N when B types do not reproduce versus when they do is shown as a function of switching rates. The white line encloses the area in parameter space in which the population grows faster if B does not reproduce. This regime has low proportion of A′ in (a) and intermediate switch rates between types. Thus, when B cannot reproduce, the population can increase its production of A′ and grow faster.

