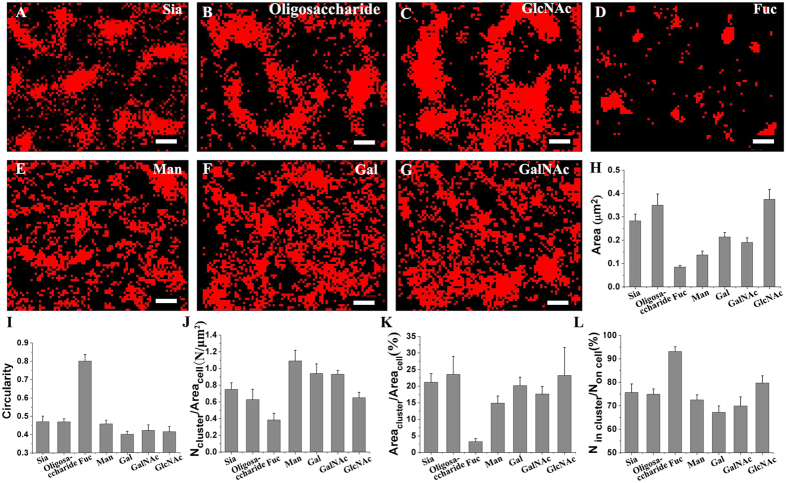
Figure 1. dSTORM imaging and cluster analysis of seven types of carbohydrates on Vero apical membranes labeled with their specific Alexa647-connected lectins.
(A–G) dSTORM images of the organization of different carbohydrates (Sia (A), oligosaccharide (B), GlcNAc (C), Fuc (D), Man (E), Gal (F), and GalNAc (G)) on Vero apical membranes, depicting sharply distributed patterns of carbohydrates at nanoscale resolution. Scale bars are 500 nm. (H,I) Histograms of the average cluster area and the circularity of all types of carbohydrate clusters. (J–L) Histograms of the cluster density on unit cell membranes (J), coverage percentage of clusters on membranes (K), and the ratio of the number of localizations in clusters to the total localizations on the entire membrane (L), which together show the distribution features of the clusters on the entire membrane. All statistical analyses are acquired from more than ten cells (mostly 10–20 cells) in three independent experiments.

