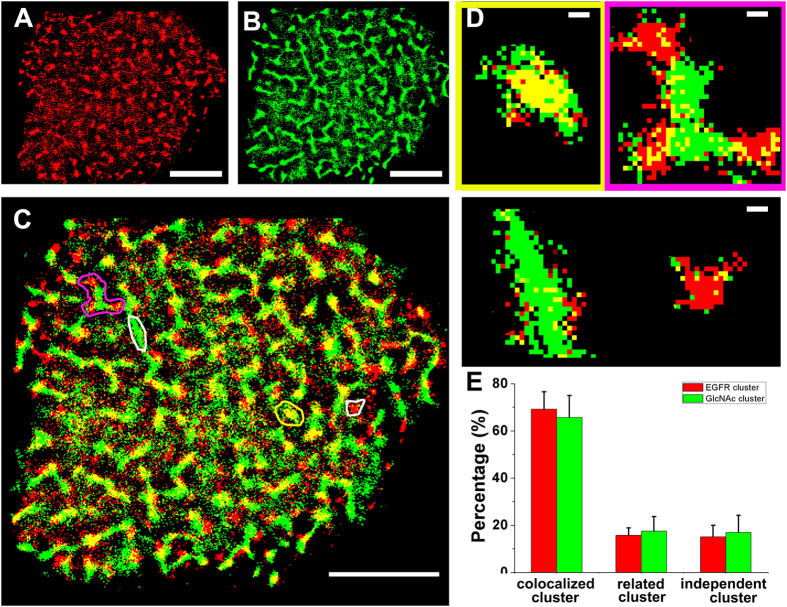
Figure 3. Dual-color dSTORM imaging of EGFR domains and GlcNAc clusters on Vero apical membranes.
(A,B) Representative dSTORM reconstructed images of the nanoscale organization of EGFR (A) and GlcNAc (B) on Vero apical membranes, labeled with Alexa647-conjucated EGF and Alexa532-linked WGA, respectively. (C) In the superimposed images of (A,B), the colocalization (yellow region) is a clear feature. (D) The enlarged images represent three typical groups of clusters, the independent clusters (white box), the colocalized clusters (yellow box), and the correlated clusters (pink box). (E) Ratios of the cluster number of each group to the total number of EGFR clusters (red columns) and GlcNAc clusters (green columns). The bars are 5 μm in (A–C) and 200 nm in (D). The statistical analysis is acquired from ten cells in three independent experiments.

