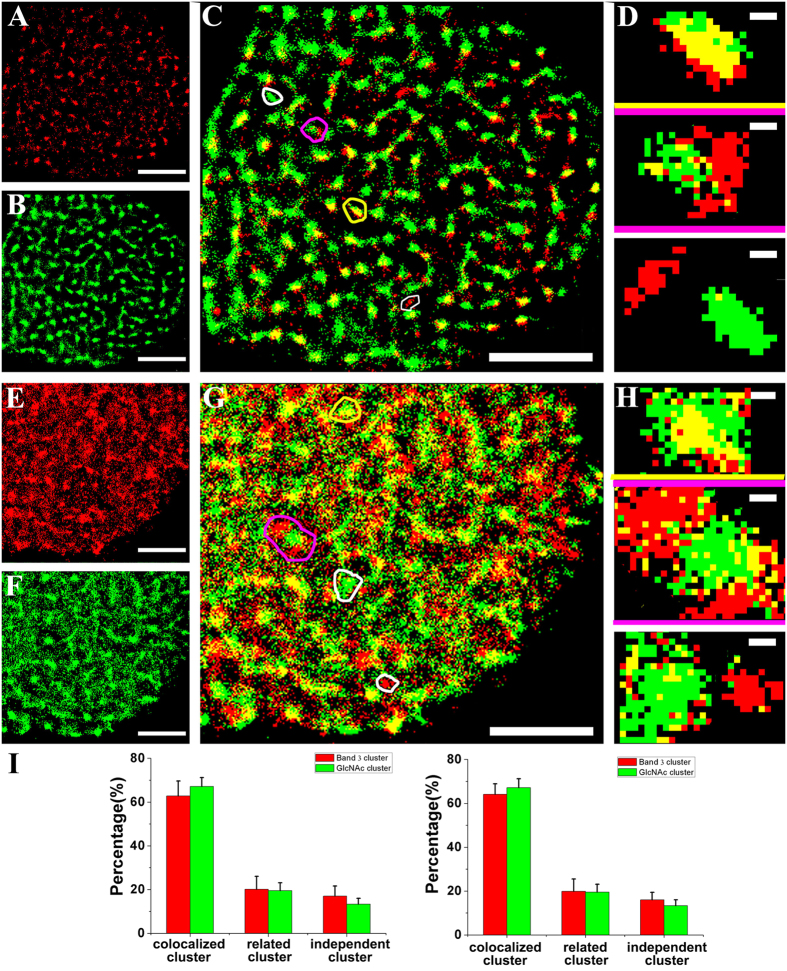
Figure 4. Dual-color dSTORM imaging of band 3 and GlcNAc on Vero apical membranes prepared with complementary protocols.
(A,B) dSTORM imaging of band 3 and GlcNAc on Vero apical membrane sheets labeled with Alexa647-linked band 3 antibody and Alexa532-linked WGA, respectively. (C) The superimposed image of (A,B) shows that most of them colocalized with each other. (D) The enlarged images illustrate three classification groups of clusters: colocalized clusters (yellow box), correlated clusters (pink box), and independent clusters (white box). (E–H) Images corresponding to (A–D) of the full cell membrane slightly perforated by saponin. (I) Histograms of the numerical percentages of three types of clusters on the membrane sheet (left) and the perforated membrane (right). Scale bars are 5 μm in (A–C) and (E–G), and 200 nm in (D,H). All statistical analyses are acquired from ten cells in three independent experiments.

