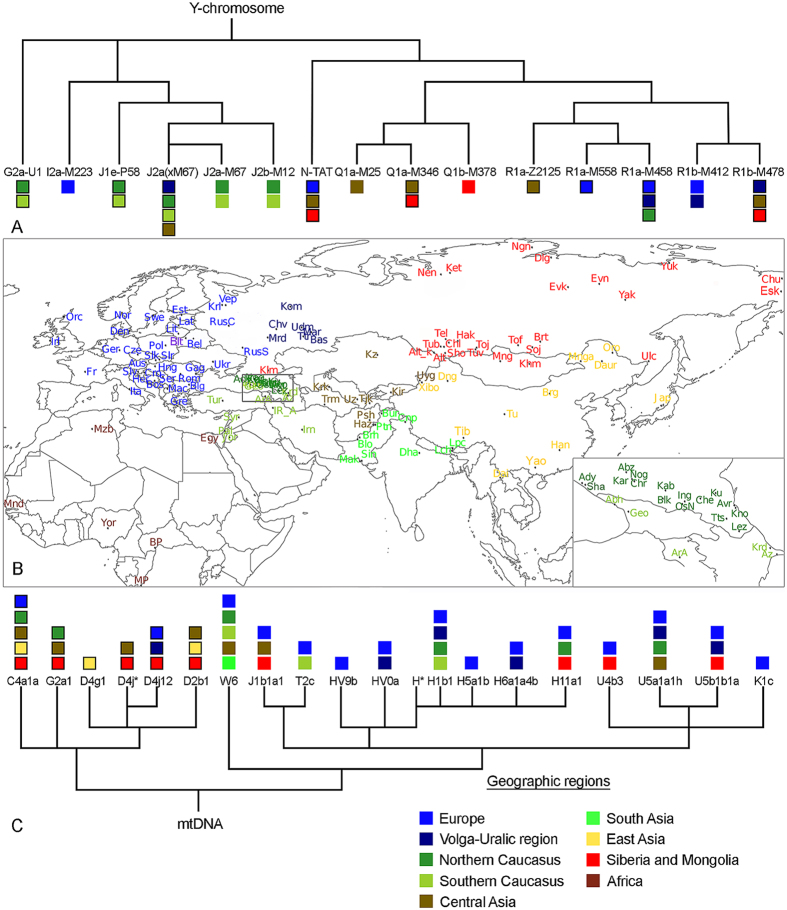
Figure 1.
(A) Schematic phylogeny of the Y-chromosome tree in Belarusian Lipka Tatars (updated from10). (B) Geographic map showing population background used in the study. Belarusian Lipka Tatars are indicated in purple. Supplementary Table 1 lists population names that correspond to the abbreviations in the map, and which populations were used in Y-chromosome, mtDNA or autosomal SNP analyses. Caucasus region is zoomed-in and shown in bottom right corner of the map. Map was created in R v3.1.1 using “maps” and “mapproj” packages (R: A Language and Environment for Statistical Computing, R Core Team, R Foundation for Statistical Computing, Vienna, Austria (2016) https://www.R-project.org”). (C) Schematic phylogeny of the mtDNA tree in Belarusian Lipka Tatars (updated from9). Colored squares at the tree tips indicate geographic regions where same Y-chromosome and mtDNA haplogroups occur nowadays. Squares with black borders indicate that phylogenetically close haplotypes between Belarusian Lipka Tatars and other populations were detected based on phylogenetic analysis of complete mtDNA sequences or Y-STR haplotypes carried out in this study; open squares summarize information on phylogeographic distribution of respective haplogroups (for full list of references see Supplementary Information Text (Full List of References for Fig. 1)). For paraphyletic mtDNA haplogroup H* no data is provided as it may correspond to different H subclades with broad geographic distribution.

