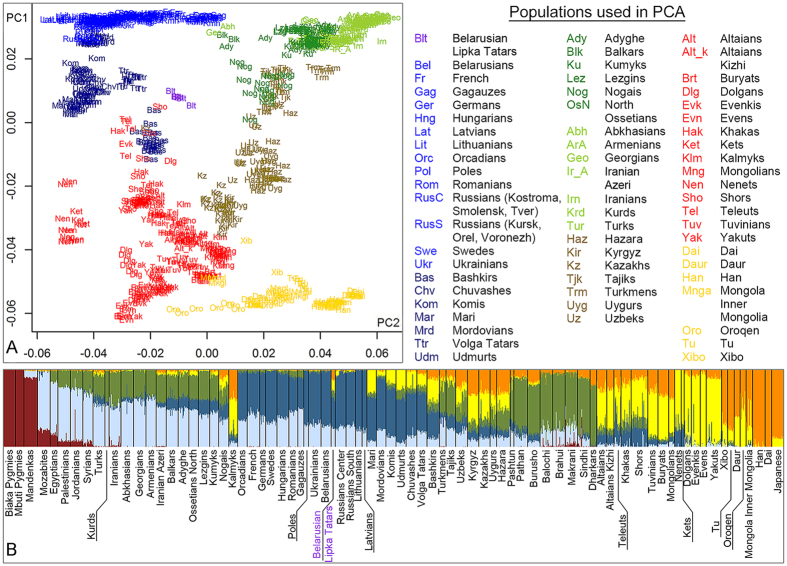
Figure 2.
(A) PC plot PC1 vs PC2 based on whole genome SNP variation in 63 Eurasian populations. PC1 = 3.8; PC2 = 0.6. (B) k6 ADMIXTURE plot showing genetic structure of Belarusian Lipka Tatars in the background of 81 world populations. Genetic structure of populations at k2-k10 is shown in Supplementary Fig. 18.

