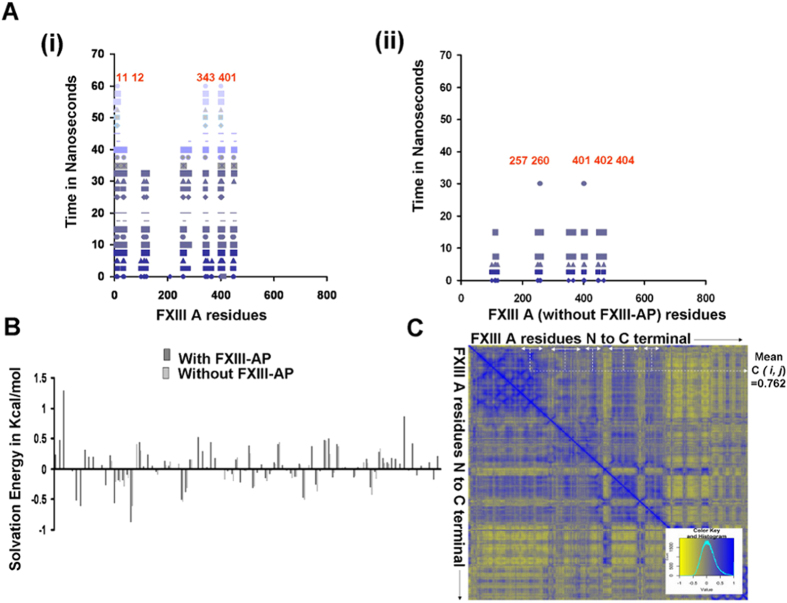
Figure 2. Steered molecular dynamic simulation of FXIIIA2 dimer dissociation into separated monomers.
(Panel A) Separation plots showing physical interactions (each spot represents an interaction observed in a specific snapshot; the spots are colored in different shades of blue and spots from the same simulation snapshot have the same shade) for residues N to C terminal (x-axis) of one FXIIIA monomer at the dimeric interface over the progress time (y-axis) of the SMD (in picoseconds). (i) Interactions for the zymogenic FXIIIA structure (with FXIII-AP); (ii) interactions for the zymogenic structure without FXIII-AP (residue numbering for both plots according to the complete zymogen primary sequence). Tha main interacting partners in FXIIIA monomer, forming the dimeric interfaces in the both the cases, are labelled in red. (Panel B) Post-simulation mean solvation energies (y-axis) for the FXIIIA subunit dimeric interface residues (x-axis). Black bars, zymogenic FXIIIA2 with FXIII-AP, Grey, without FXIII-AP. (Panel C) Calculated DCCM (dynamic cross correlation matrix) values for the 60 ns SMD simulation of FXIIIA monomer dissociation from zymogenic FXIIIA2 dimer with FXIII-AP. Color key shown as inset: yellow, negative correlation; blue, positive correlation. The bidirectional white arrows represent the positively correlated region between the FXIII-AP residues and the corresponding FXIIIA dimeric interface residues (not including the FXIII-AP).

