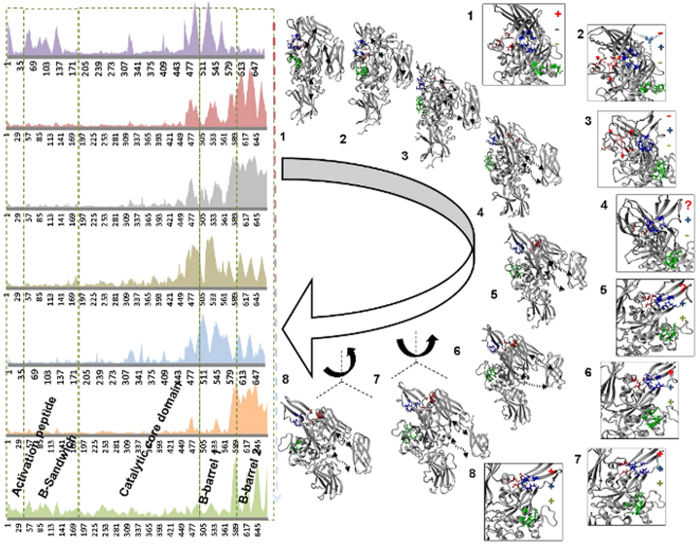
Figure 3. Domain displacements and structural changes in calcium binding sites for the simulated transition state intermediate models.
Domain displacements and structural changes in calcium binding sites observed within transition state intermediate models (n = 8). RMSD values per backbone alpha-carbon for each residue of FXIIIA (left side). Y-axis values are normalized RMSD in Å, x-axis denotes the backbone alpha Carbon (N to C terminal), with domains specified. Next to arced open arrow (middle) are models of the 8 transition state intermediate (grey). Calcium binding sites are Cab1 (red), Cab2 (blue) and Cab3 (green). Direction of motions of domains due to calcium binding is shown with small black dashed double-headed arrows. The direction and relative magnitude of twisting motions are depicted next to intermediates 6–8 (straight dashed lines indicate x-, y- and z-axes for an arbitrary reference frame representing the orientation of each intermediate as shown). The boxed images (right) are close up views showing the location, formation and/or disruption of three calcium binding sites for the 8 intermediates. The coordination states of the calcium binding sites are indicated either with bound calcium (+) or with no calcium bound (−). Arrows indicate simulated movements of Ca2+ ions relative to each binding site. Residues forming the calcium binding sites are shown in stick format.

