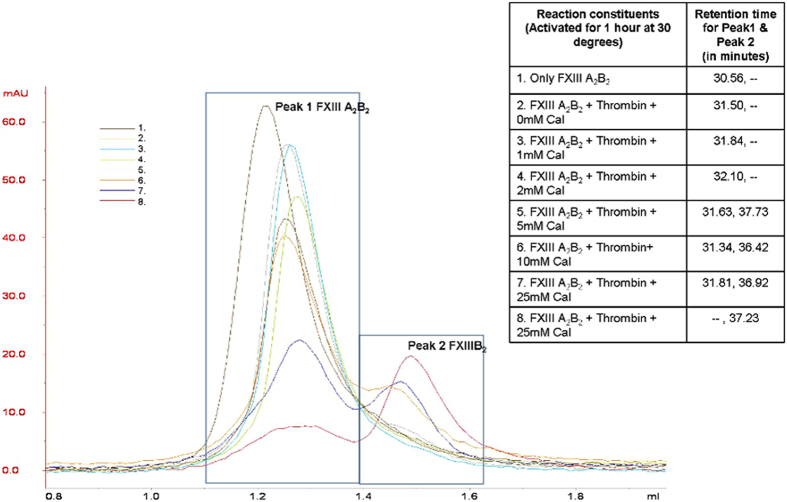
Figure 7. In vitro dissociation of the FXIIIA2B2 heterotetramer observed by gel filtration.
Gel filtration elution profiles for purified heterotetramer FXIIIA2B2, at various calcium & thrombin concentrations in local environment during in-vitro activation. The color key (with number) depicts the different treatment conditions during activation (number corresponds to the table on right). X-axis shows the retention volume of peak; y-axis shows the amount of protein in mAU. The table also details the retention time of the peaks corresponding to FXIIIA2B2 (peak 1) and FXIIIB2 (peak 2), at different conditions, respectively. Protein identities eluted at peak maxima confirmed by mass spectrometry (Supplementary Figure S10).

