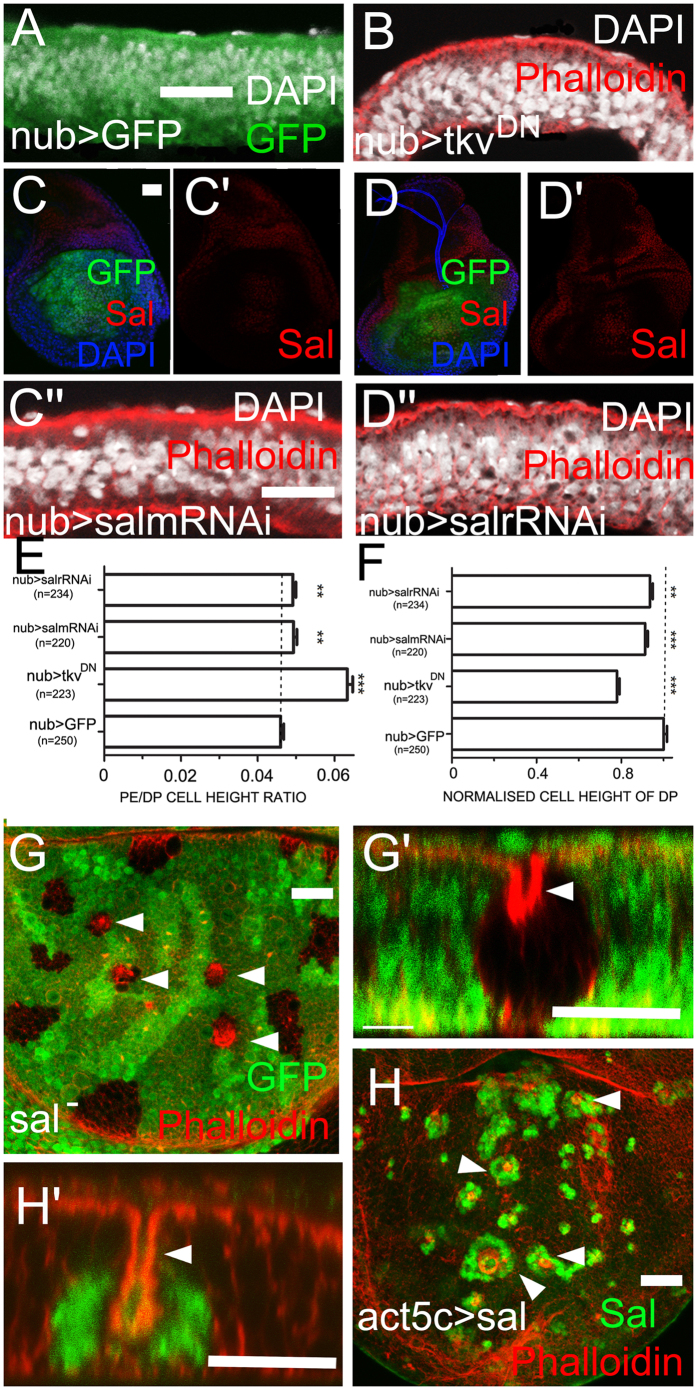
Figure 3. sal affects DP height.
(C,C′, D,D′, G,H) are x-y views. Other images are x-z views. (A) GFP expressing control. (B) Expression of UAS-tkvDNreduces DP height. (C–C″) Expression of salm-RNAi (nub>salm-RNAi) reduces Sal levels in the DP (C and C′) and slightly reduces DP height (C″). (D) Expression of salr-RNAi (nub>salr-RNAi) reduced Sal levels in the DP (D and D′) and slightly reduces DP height (D″). The changes in PE height are not apparent but are statistically significant based on the PE/DP height ratio (E,F). (G) sal mutant clones (absence of GFP, arrowheads) in the medial DP undergo apical retraction (G′, arrowhead). (H) sal-overexpressing clones (absence of GFP, arrowheads) in the medial DP undergo apical retraction (H′, arrowheads).

