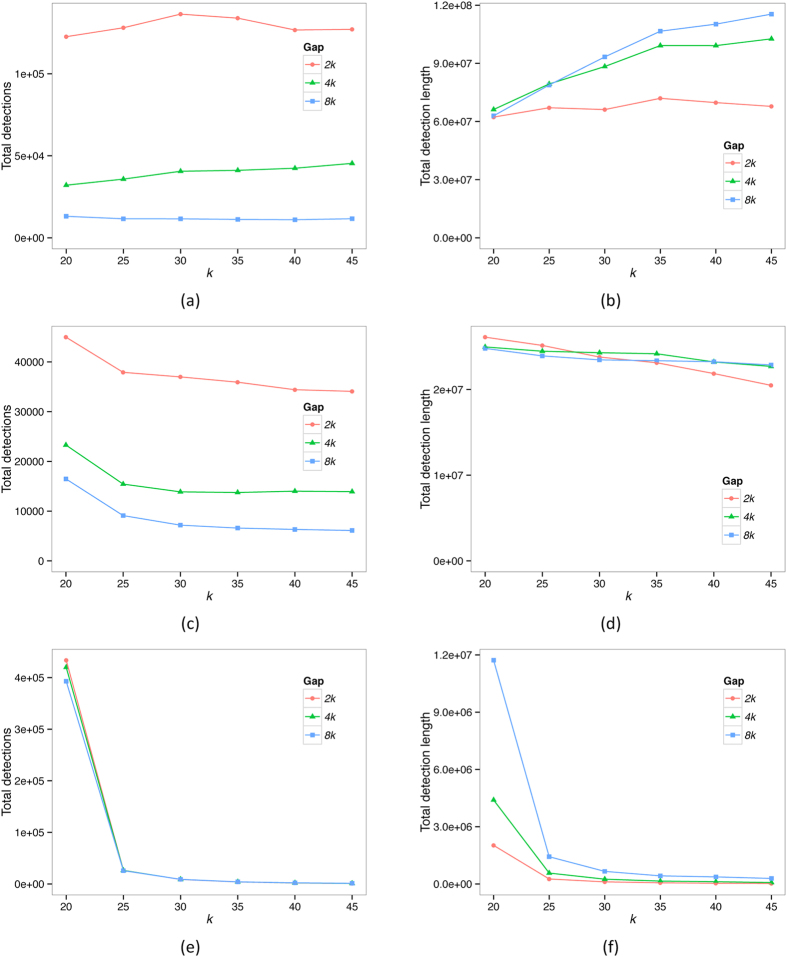
Figure 1. Number of regions detected as lateral, as a function of k and G.
The panels on the left show total numbers of LGT detections in the ECS (panel a), EB (panel c) and BA (panel e) datasets. The panels on the right show the total length (in nucleotides) of all LGT detections in the same datasets.

