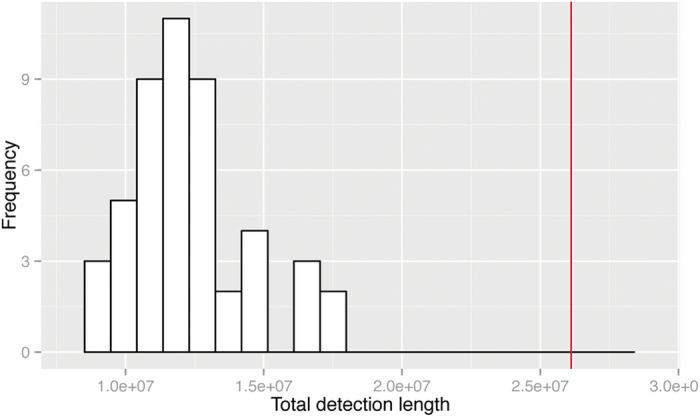
Figure 4. Histogram of the distribution of total length of all detections of the 50 randomly assigned replicates.

The total detection length in the actual grouping (based on cutting the MRP supertree) is shown as a red line.

The total detection length in the actual grouping (based on cutting the MRP supertree) is shown as a red line.