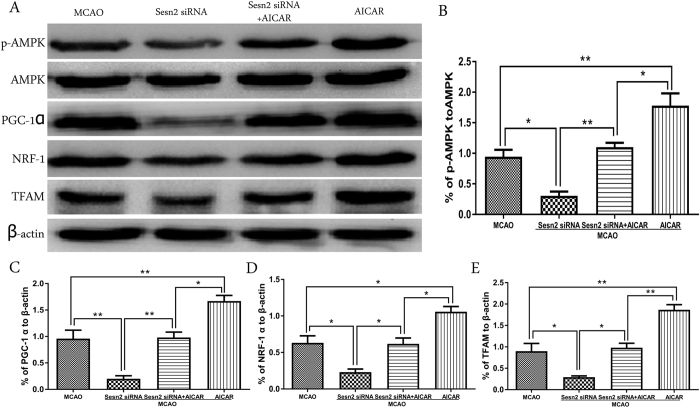
Figure 7. Representative western blots p-AMPK, AMPK, PGC-1α, NRF-1 and TFAM. Relative protein band density values were calculated as the ratio of protein of interest to that of β-actin.
Quantification of (A) is shown in (B–E) respectively. Error bars represent mean ± SEM. (*p < 0.05; **p < 0.01). n = 4 in the sham group, n = 6 in the other groups.

