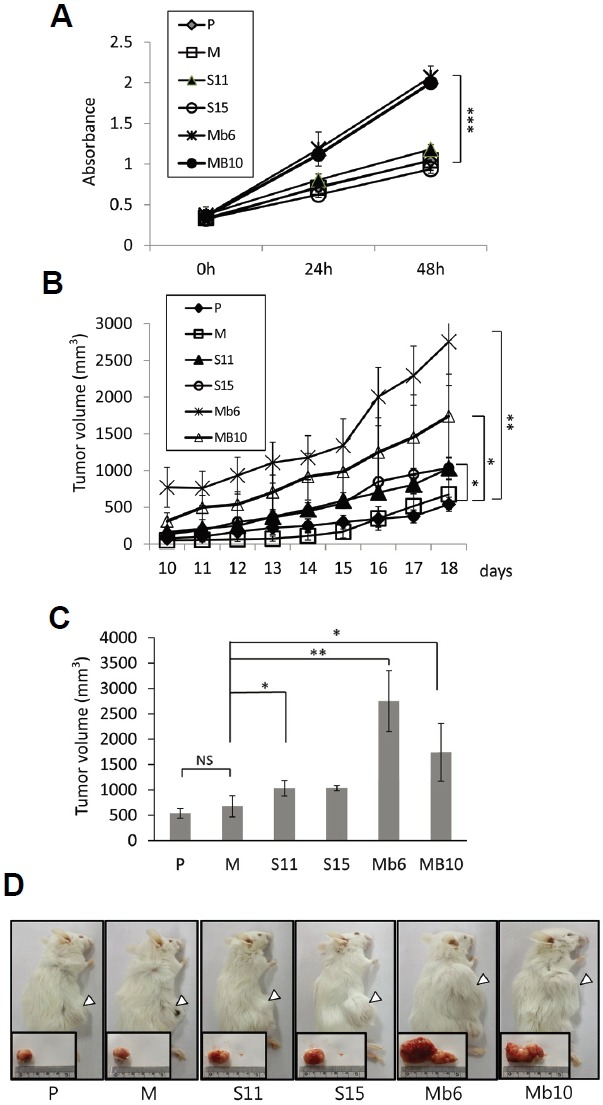
Fig. 2.

Mb-IL-17A enhances the growth rate and tumorigenicity of CT26 cells. (A) The 1 × 10⁴ cells of the wild-type CT26 cells (P) and the indicated transfectants were seeded in 96-well plates. Their growth rates were analyzed by MTT assay over 48 h. Data represent means ± SEM of three independent experiments. The statistical significance of the differences between Mb6 and MB10 vs. M were analyzed by one way analysis of variance (ANOVA). ***P < 0.001. (B) Aliquots of 1 × 10⁶ cells of each subline were injected into mice subcutaneously. Tumor size was measured with a Vernier caliper and calculated as described in “Materials and Methods”. (C) Tumor volumes on day 18 after tumor clone implantation. The differences between S11, Mb6 and MB10 vs. M were analyzed by one way ANOVA. *P < 0.05; **P < 0.01; NS, not significant. (D) The animals were killed on day 25 after tumor clone implantation, and tumor tissues were collected. Representative photos of the animals and their tumors in the various groups are shown.
