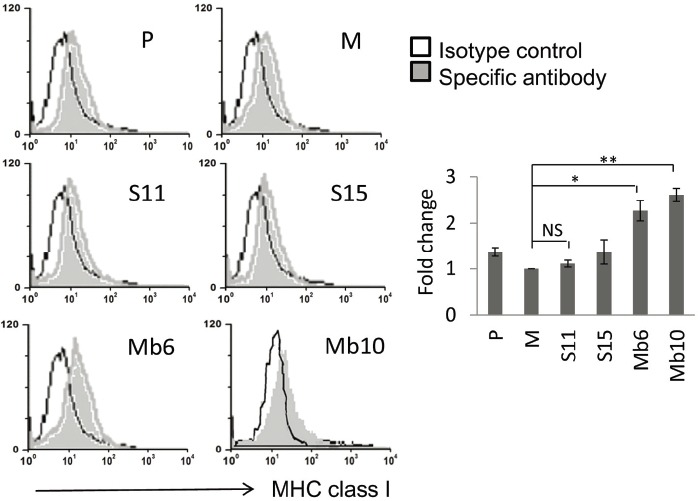
Fig. 5.

Surface MHC class I expression is induced by ectopic expression of Mb-IL-17A. MHC class I expression was analyzed in the indicated clones using anti-Ld MHC Class I monoclonal antibody (24-14-8S) and FITC-conjugated secondary anti-mouse IgG. Cells were analyzed by flow cytometry (left). The relative changes of mean values against M, measured by flow cytometry, are represented by the bar graphs. Differences between groups were analyzed using two-way ANOVA. *P < 0.05; **P < 0.01; NS, no significant (right).
