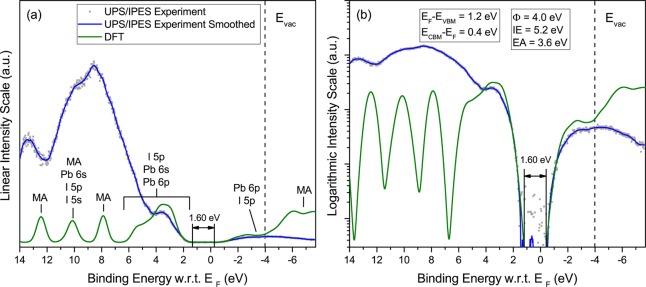
Figure 1.
(a) Comparison between UPS and IPES spectra measured from MAPbI3 and DFT-based theoretical simulations, plotted on a linear intensity scale. The energy scale is referenced to the Fermi level, EF (0 eV). The position of the vacuum level EVAC is indicated; major atomic orbital contributions are indicated. (b) Same as panel a for data displayed on a logarithmic intensity scale. The extracted values for IE, EA, the work function ϕ and the energy gap apply to both panels a and b. The 200–300 nm thick MAPbI3 films were grown on compact TiO2/FTO.

