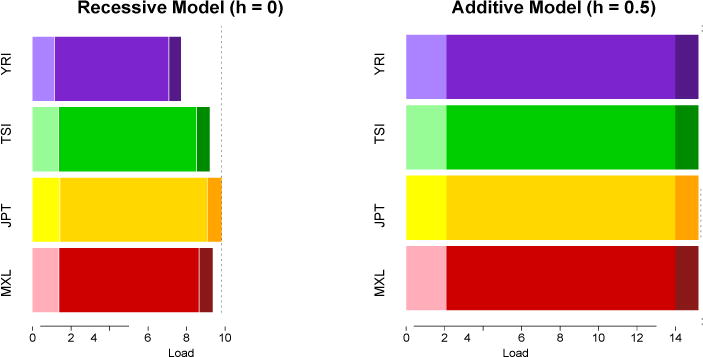
Figure 5. Mutational load under an additive and a recessive model.

Using the same dataset as in Figure 2, we computed the total mutation load2 for each population. GERP scores were annotated in whole-exome data. Variants were grouped in three categories according their GERP score (2:4, 4:6, >6), corresponding to different biological functional effects. The more phylogenetically conserved a site is, the more likely a new allele is to be deleterious and have a high GERP score (Box S1). Within each category, three selection coefficients were assigned: (s= −4.5 × 10⁻⁴), (s= −4.5 × 10⁻³) and (s= −1 × 10⁻²), using the inferred s coefficients in Boyko et al.45. Total mutational load is the sum of load for each locus2. Mutational load under an additive model is higher than mutational load under a recessive model because the phenotypic effect of a variant is masked in the recessive homozygous state. While only slight differences exist between populations for an additive model of dominance (~1.5%), strong differences occur under a recessive model because of the differential number of derived homozygotes among populations.
