Figure 6.
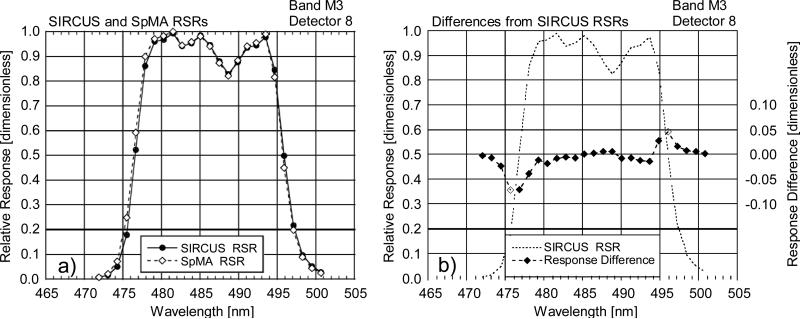
Comparison of RSRs from the SpMA and SIRCUS for VIIRS band M3, detector 8. This comparison shows differences (SpMA from SIRCUS) at the SpMA wavelengths. The SIRCUS ASRs have been normalized to unity and interpolated to the SpMA wavelengths. Since SIRCUS provides a greater number of measurements per unit wavelength, the interpolation has removed details from the set of SIRCUS RSRs.
a) SIRCUS and SpMA RSRs.
b) Response Differences (SpMA from SIRCUS). The scale for the differences is given at the right-hand ordinate. The units for the differences are the same as those for the responses, themselves. An outline of the SIRCUS RSR is provided as a visual reference for the locations of the band edges.

