
FIG 8.
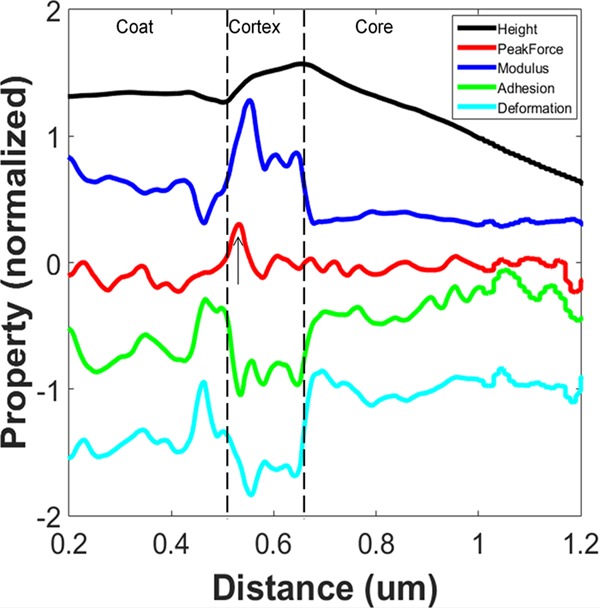
Changes of surface morphology and properties across the cross-section of a freshly cut spore (sample 1). All curves were normalized along the scan direction in the x axis and shifted in the y axis, except for the peak force curve. The modulus data were on the logarithmic scale. The following AFM parameters were used: scan size, 1,000 nm; scan rate, 1 Hz; number of samples/line, 512; line direction, retrace; capture direction, up; scan angle, 0°; control gain, 12; amplitude set point, 1.8 nN; drive amplitude, 120 nm at 2 kHz; spring constant, 0.5 N/m; tip radius, 10 nm.