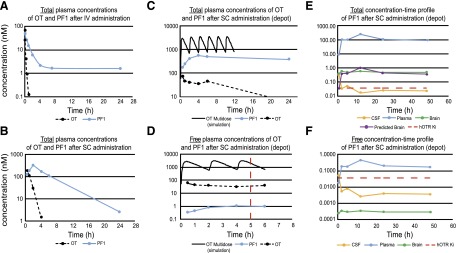
Fig. 2.
Pharmacokinetics of OT and PF-06655075 (PF1). (a) PF1 has an extended t½ in comparison with OT after i.v. administration to rats, (b) s.c. non–depot administration of PF1 and OT to mice, (c) incorporation of OT or PF1 into the depot formulation resulting in sustained total concentrations after s.c. administration versus the non–depot vehicle and simulation of s.c. multidosing OT in a non–depot vehicle, (d) corresponding free concentration time profiles in the depot formulation and after OT multidosing presented on the time scale of the behavioral experiments (red dashed line indicates time of testing), (e) total concentration-time profiles (brain, plasma, and CSF) of PF1 in rats, and (f) corresponding free concentration-time profiles (brain, plasma, CSF) of PF1 in rats.

