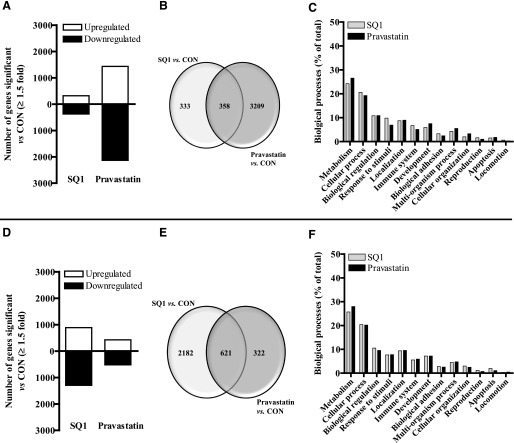
Fig. 2.
Characterization of gene expression changes in primary cultured mouse (A–C) and rat (D–F) hepatocytes after treatment with SQ1 or pravastatin identified using microarrays. Primary mouse and rat hepatocytes were freshly isolated and plated onto six-well plates as described in the Materials and Methods. Forty-eight hours after initial plating, hepatocytes were treated with Williams’ E medium either alone (control, CON) or containing SQ1 (0.1 μM) or pravastatin (30 μM). The culture medium was replaced once after 24 hours. Forty-eight hours after the initial drug treatment, total RNA was isolated from the hepatocytes, and fluorescent-labeled RNA was synthesized and hybridized onto Agilent whole-genome microarrays as described in Materials and Methods (n = 8/treatment group/species). Significant differences in the normalized fluorescence intensities (≥1.5-fold) among the different drug treatments (SQ1 versus CON, pravastatin versus CON) were detected using GeneSpring. (A, D) The total number of transcripts significantly affected by either SQ1 or pravastatin in mouse (A) and rat (D) hepatocytes. (B, E) Venn diagrams displaying the number of common and unique transcripts significantly affected among the different drug treatments in mouse (B) and rat (E) hepatocytes. (C, F) Functional distribution of known gene changes from mouse (C) and rat (F) hepatocytes grouped into biologic categories. Data are presented as percentage of total gene changes.

