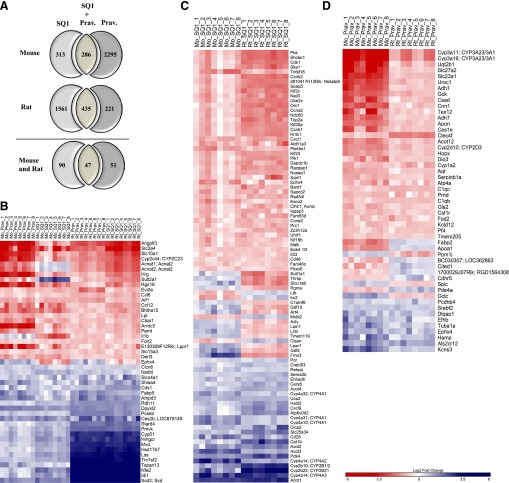
Fig. 3.
Orthologous genes affected by both SQ1 and Prav treatment in primary cultured mouse and rat hepatocytes identified using microarrays. Treatment-specific orthologs were retrieved using Homologene and the rat genome database as described in Materials and Methods. (A) Venn diagram displaying the number of putative orthologs that were significantly affected by either SQ1 alone, both SQ1 and Prav, or Prav alone in mouse (upper panel) and rat hepatocytes (middle panel) and used to screen for conserved gene changes. The lower panel displays the number of treatment-specific orthologs that were commonly and uniquely affected in both species. (B–D) Heat maps displaying the normalized (log2) expression values of orthologs (B) commonly affected by both SQ1 and Prav, (C) unique to SQ1-treated hepatocytes, and (D) unique to Prav-treated hepatocytes (n = 8/treatment group/species). When ortholog names differed between species, the mouse name is provided first followed by the rat name. Blue-colored bars indicate up-regulated genes, and red-colored bars indicate down-regulated genes.

