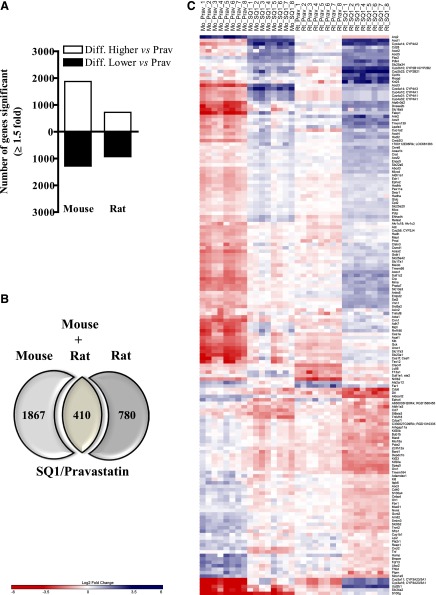
Fig. 4.
Hepatic expression of orthologs differentially affected by SQ1 compared with Prav in primary cultured mouse and rat hepatocytes identified using microarrays. Treatment-specific orthologs were retrieved using Homologene and the rat genome database as described in Materials and Methods. (A) The total number of transcripts differentially affected in SQ1-treated compared with Prav-treated mouse and rat hepatocytes. (B) Venn diagram displaying the number of orthologs differentially affected by SQ1 compared with Prav treatment (≥1.5-fold) in primary cultured mouse and rat primary hepatocytes. (C) A heat map displaying the normalized (log2) expression values of orthologs differentially expressed in SQ1 compared with Prav-treated hepatocytes isolated from mice and rats (n = 8/treatment group/species). When ortholog names differed between species, the mouse name is provided first followed by the rat name. Blue-colored bars indicate up-regulated genes, and red-colored bars indicate down-regulated genes.

