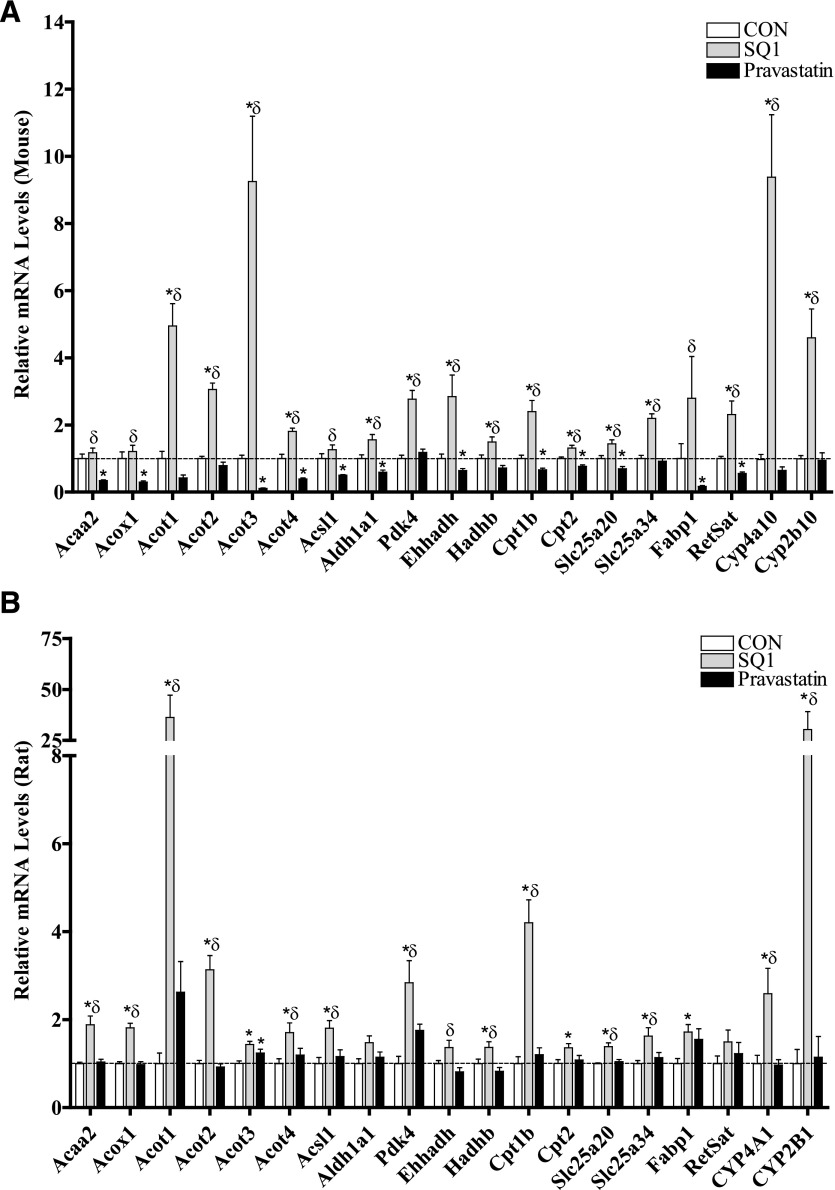
Fig. 6.
Validation of select regulated genes identified through microarrays by qRT-PCR in primary cultured mouse (A) and rat (B) hepatocytes. Primary mouse (A) and rat (B) hepatocytes were freshly isolated and plated onto six-well plates, and 48 hours later were treated with Williams’ E medium either alone (control, CON) or containing SQ1 (0.1 μM) or Prav (30 μM). The medium was replaced once after 24 hours, and 48 hours after the initial treatment total RNA was isolated and cDNA synthesized as described in Materials and Methods. Relative changes in mRNA expression levels were determined using qRT-PCR. Each bar represents the normalized values (mean ± S.E.M.) from five to six hepatocyte preparations (two combined wells/treatment group/preparation). *Statistically significant compared with untreated (CON) hepatocytes (P < 0.05). δStatistically significant compared with Prav-treated hepatocytes (P < 0.05).

